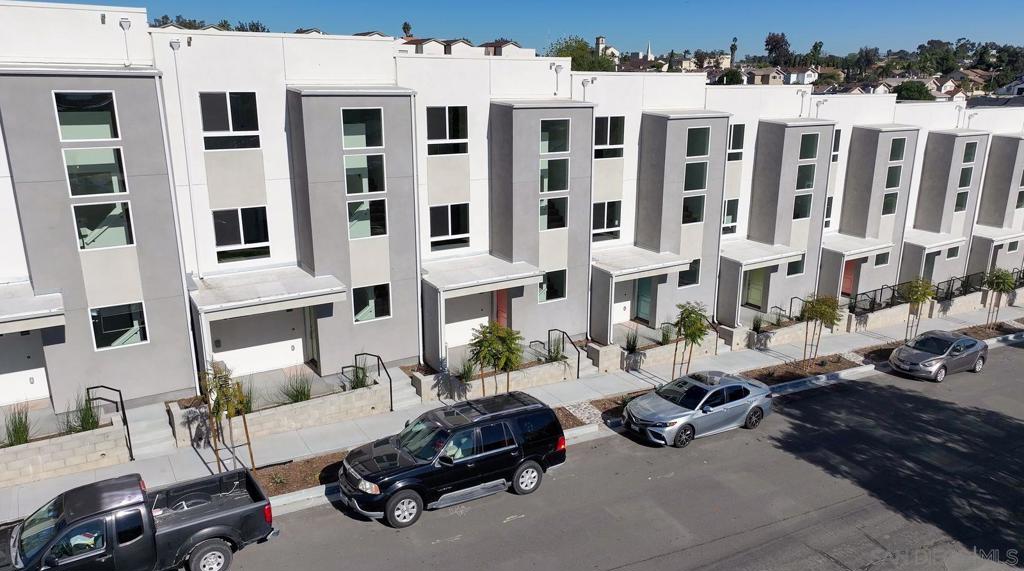
4952 Ocean View Blvd
Btop 30%San Diego, CA 92113
16 licensed short-term rentals within ½ mile (7 whole home), from the cities' license and permit lists of Nov 13, 2026.
HOA rules unknown: an HOA can ban stays under 30 days (Civ. Code §4741), and no permit on file shows this one allows them. Get the CC&Rs.
Pass at asking: -$3,145/mo full cashflow at 20% down, 7.36% rate.
Works at $344,383 (54% under asking), or at 81% down.
Rent $3,658/mo from 10 leases of 2–4 bed houses within 1 mi ($3,570–$3,856).
Beds
3
Baths
3
Sqft
1,479
Year Built
2025
Days on Market
293
Property Type
Single Family
HOA/mo
$185.25
MLS ID
260001835SD
This property is in San Diego (92113). Browse neighborhood analytics →
About This Property
NEW CONSTRUCTION SFD TOWNHOMESTYLE (DETACHED PUD). THREE FULL BEDROOMS AND THREE FULL BATHS, TWO CAR GARAGE WITH PAID FOR SOLAR. LOTS OF LIGHT, SOARING CEILINGS, MODERN LAYOUT THAT IS SPACIOUS AND EFFICIENT.There are two styles in this community Plan 1 (subject) and Plan 2, please ask for info. Close to 805, 5, 15, 94 and 125 freeways. Absolutely a great place that is centrally located and close to downtown and many other activities and attractions. Modern lighting and amenities as well as mini split for AC and heating. No Mello Roos, BUILDER WILL WORK WILL BUYERS AND HELP WITH CLOSING COSTS.
Mortgage Calculator
Est. Monthly Payment
$5,332
Location
Loading map...
Zoned Schools
Elementary
Porter Elementary · grades PK-6 · San Diego Unified
Middle
Knox Middle · grades 6-8 · San Diego Unified
High
Lincoln High · grades 9-12 · San Diego Unified
The district's assigned schools for this parcel, from its attendance boundaries and rules. Boundaries change: confirm with the district before you buy.
Comparable Properties
5 comps foundThis Property
$3,658
Comp Average
$3,499

4958 Ocean View Boulevard
3bd / 3ba · 1,479 sqft · Single Family
$579K
Est. $3,499/mo

4954 Ocean View Boulevard
3bd / 3ba · 1,479 sqft · Single Family
$696K
Est. $3,499/mo

4956 Ocean View Blvd
3bd / 3ba · 1,479 sqft · Single Family
$696K
Est. $3,499/mo

4964 Ocean View Blvd.
3bd / 3ba · 1,479 sqft · Single Family
$730K
Est. $3,499/mo

4966 Ocean View Boulevard
3bd / 3ba · 1,479 sqft · Single Family
$730K
Est. $3,499/mo
Comps based on same zip code, similar beds (±1), price range (60-150%).
Investment Score
10 leases of 2–4 bed houses within 1 mi · $3,570–$3,856
Blended 50/50 with a property-level estimate
Rent − PITIA
Incl. vacancy, PM, maint, capex
What would make this work?
$3,145/mo short at 20% down; 81% down or +$4,084/mo rent closes it.
- Break-even price
- $344,383
- Break-even rent
- $7,742/mo
- Cashflow at 35% down
- −$2,363/mo
- Down payment to break even
- 81%
- Rate to break even
- Not reachable
54% under asking
$4,084/mo above the estimate
$612,279 cash
Negative even at a 0% loan
Need ≥ 1.25 for DSCR loan
Lower = better for investors
* Modelled at 20% down, 7.36% rate, 30yr · vacancy 8% · PM 10% · capex 5% · maintenance 1%/yr.
Estimates only. Not financial advice. Verify all figures independently with a licensed professional before making any investment decision.
Open Full Calculator