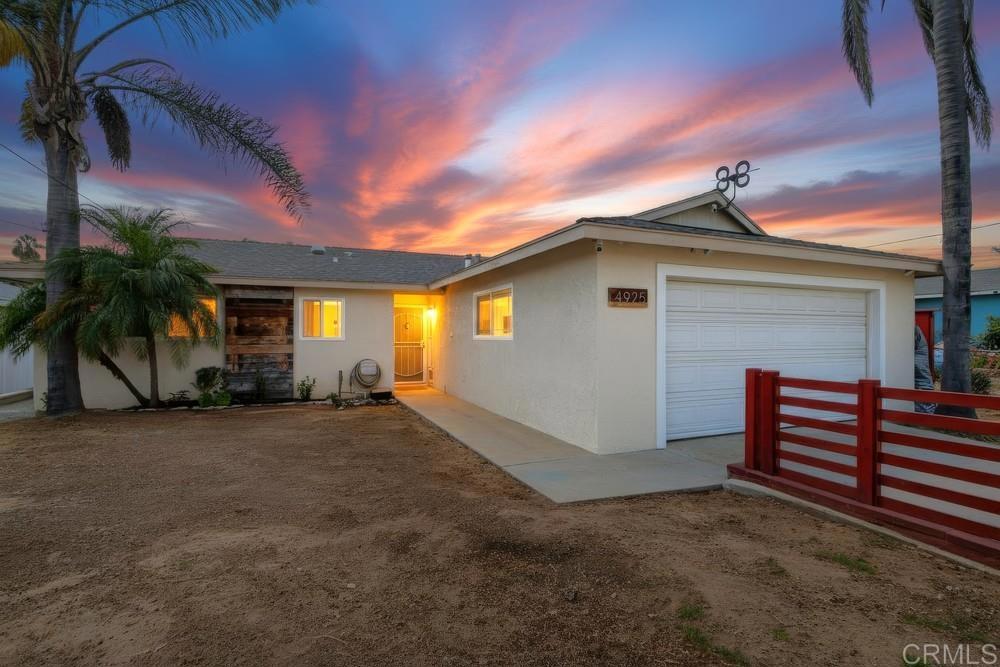
4925 Siesta Drive
Atop 10%Oceanside, CA 92057Neighborhood: North Valley
3 licensed short-term rentals within ½ mile (3 whole home), from the cities' license and permit lists of Nov 13, 2026.
Pass at asking: -$2,532/mo full cashflow at 20% down, 7.36% rate.
Works at $408,693 (45% under asking), or at 70% down.
Rent $4,056/mo from 9 leases of 2–4 bed houses within 1 mi ($3,636–$4,016).
Beds
3
Baths
2
Sqft
1,496
Year Built
1964
Days on Market
56
Property Type
Single Family
HOA/mo
N/A
MLS ID
NDP2608722
This property is in Oceanside (92057). Browse neighborhood analytics →
About This Property
3 bed, 2 full bath with 2-car garage. Spacious floor plan gives you both a living room and family room plus a cozy fireplace. Fully remodeled kitchen with plenty of cabinet space and newer appliances. Newer upgraded fixtures and dual-pane windows throughout. Both baths completely redone with designer tile, fixtures. lighting and wainscoting. Skylight and whole-house fan keep it bright and comfortable. Step outside to your private backyard and the star of the show—a just-renovated heated in-ground pool and spa. Move-in ready and fully upgraded. Libby Elementary 8/10 rating within walking distance from home.
Mortgage Calculator
Est. Monthly Payment
$5,038
Location
Loading map...
Zoned Schools
Elementary
Libby Elementary · grades K-5 · Oceanside Unified
Middle
Cesar Chavez Middle · grades 6-8 · Oceanside Unified
High
El Camino High · grades 9-12 · Oceanside Unified
The district's assigned schools for this parcel, from its attendance boundaries and rules. Boundaries change: confirm with the district before you buy.
Comparable Properties
5 comps foundThis Property
$4,056
Comp Average
$3,749

3902 Vista Campana
2bd / 2ba · 1,527 sqft · Single Family
$599K
Est. $3,561/mo

1683 Bronco
3bd / 2.5ba · 1,543 sqft · Single Family
$765K
Est. $3,939/mo

305 Trunks
3bd / 2ba · 1,352 sqft · Single Family
$750K
Est. $3,663/mo

4724 Ventana Way
3bd / 2.5ba · 1,532 sqft · Single Family
$835K
Est. $3,762/mo

4025 Ivey Vista Way
3bd / 2.5ba · 1,438 sqft · Single Family
$850K
Est. $3,822/mo
Comps based on same zip code, similar beds (±1), price range (60-150%).
Short-term not available here. Outside Oceanside's Coastal Zone: inland short-term rentals are banned. See the rules
Investment Score
9 leases of 2–4 bed houses within 1 mi · $3,636–$4,016
Blended 50/50 with a property-level estimate
Rent − PITIA
Incl. vacancy, PM, maint, capex
What would make this work?
$2,532/mo short at 20% down; 70% down or +$3,288/mo rent closes it.
- Break-even price
- $408,693
- Break-even rent
- $7,344/mo
- Cashflow at 35% down
- −$1,766/mo
- Down payment to break even
- 70%
- Rate to break even
- Not reachable
45% under asking
$3,288/mo above the estimate
$517,930 cash
Negative even at a 0% loan
Need ≥ 1.25 for DSCR loan
Lower = better for investors
* Modelled at 20% down, 7.36% rate, 30yr · vacancy 8% · PM 10% · capex 5% · maintenance 1%/yr.
Estimates only. Not financial advice. Verify all figures independently with a licensed professional before making any investment decision.
Open Full Calculator