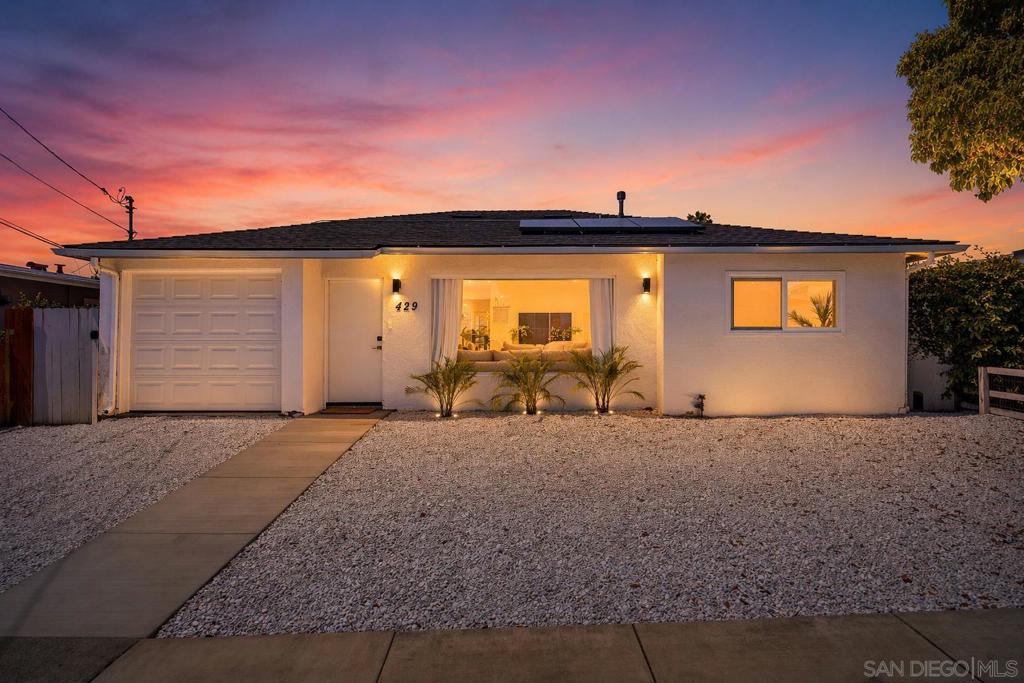
429 Garfield St
DOceanside, CA 92054
Beds
3
Baths
2.5
Sqft
1,212
Year Built
1958
Days on Market
1
Property Type
Single Family
HOA/mo
N/A
MLS ID
260008937SD
This property is in Oceanside (92054). View neighborhood stats →
About This Property
Coastal Investment Opportunity | House Hacking | ADU Potential + Alley Access. Fully upgraded coastal home with income and development potential located WEST of the 5 in one of Oceanside’s most walkable neighborhoods just a short stroll to the beach, pier, shops, and restaurants. This 3-bedroom, 2.5 bath home offers a versatile layout with two bedrooms featuring PRIVATE exterior entrances, ideal for house hacking, rental INCOME, or multigenerational living. A primary bathroom has been added, creating a functional 2-bath configuration. Major system upgrades include a new energy-efficient cool roof, central HVAC system with A/C and heating, updated electrical with recessed lighting, dual-pane windows, and hydro-jetted plumbing. Additional improvements include newly added drainage, upgraded fencing with security features, and a dedicated outdoor laundry room with hookups and sauna-ready electrical. The exterior has been enhanced with new concrete work, low-maintenance landscaping, and expanded parking, an uncommon feature in this highly walkable coastal area. Situated on a ~5,948 sq ft lot with ALLEY access and RS zoning, the property offers development potential with approved plans in progress for a garage ADU and additional units with SB9 (buyer to verify). Significant upfront improvements and development groundwork already completed saving the next owner both time and money. Images have been digitally altered for marketing purposes. The original, unaltered images, plus available UPGRADES and BUILDING PLANS, are available here: https://bit.ly/4culeAw
Mortgage Calculator
Est. Monthly Payment
$8,253
Location
Loading map...
Comparable Properties
5 comps foundThis Property
$4,550
Comp Average
$3,834

540 Barnwell Street
3bd / 2ba · 1,430 sqft · Single Family
$919K
Est. $4,789/mo

2937 Barnwell Street
3bd / 2ba · 1,186 sqft · Single Family
$850K
Est. $3,825/mo

845 Harbor Cliff Way
2bd / 2.5ba · 1,146 sqft · Condo
$800K
Est. $3,518/mo

2120 Coast Highway
2bd / 2ba · 1,590 sqft · Condo
$795K
Est. $3,518/mo

1021 Costa Pacifica Way
2bd / 2ba · 1,191 sqft · Condo
$898K
Est. $3,518/mo
Comps based on same zip code, similar beds (±1), price range (60-150%).
Investment Score
Rent − PITIA
Incl. vacancy, PM, maint, capex
⚠️ Need ≥ 1.25 for DSCR loan
Lower = better for investors
* Defaults: 20% down, 6.5% rate, 30yr.
Estimates only. Not financial advice. Verify all figures independently with a licensed professional before making any investment decision.
Get Expert AnalysisOpen Full Calculator