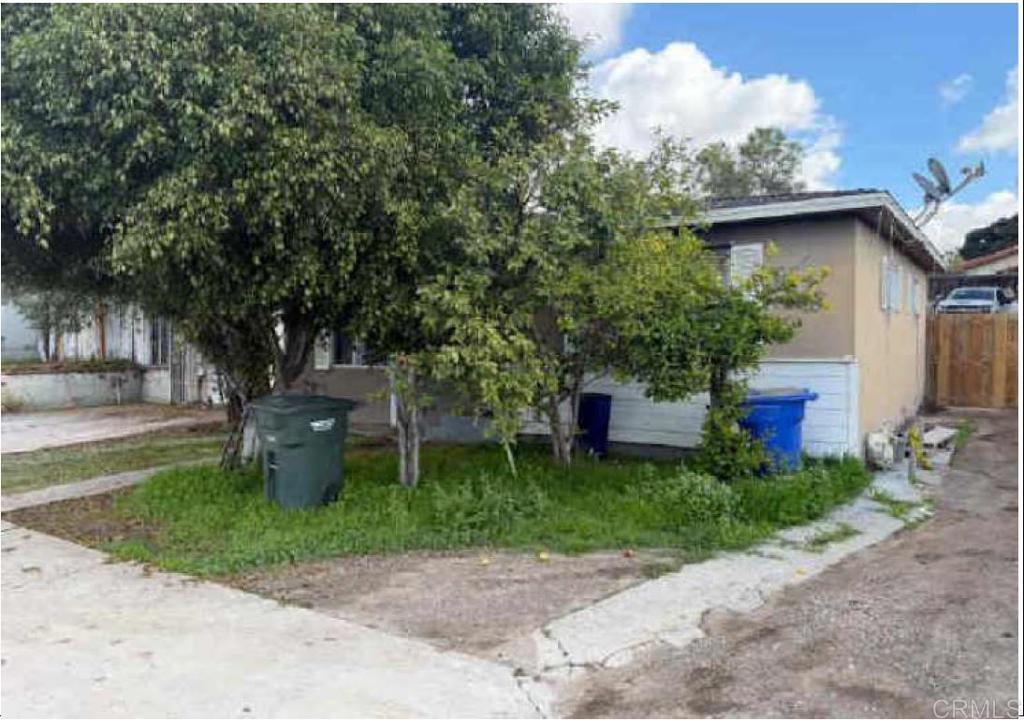
716 Civic Center Drive
Ctop 80%Vista, CA 92084
Pass at asking: -$3,589/mo full cashflow at 20% down, 7.36% rate.
Works at $289,426 (62% under asking), or at 89% down.
Rent $2,872/mo from 9 leases of 1–3 bed houses within 2 mi ($2,641–$3,028).
Beds
2
Baths
1
Sqft
895
Year Built
1953
Days on Market
61
Property Type
Single Family
HOA/mo
N/A
MLS ID
NDP2608569
This property is in Vista (92084). Browse neighborhood analytics →
About This Property
Single Family Home situated on approximately 0.29 acre, 716 Civic Center Drive features an approximately 895-square-foot single-story residence, a one-car garage, and a spacious rear yard approx. 12,564 SF lot size.. The existing home offers renovation and rental potential, while mixed-use zoning provides an opportunity to explore future development, subject to City approval. This North San Diego County location offers convenient access to SR-78 and surrounding commercial amenities. Buyer to independently verify square footage, lot sizes, zoning, permitted uses, development potential, and all information material to the purchase.
Mortgage Calculator
Est. Monthly Payment
$5,168
Location
Loading map...
Zoned Schools
Elementary
Foothill Oak Elementary · grades K-5 · Vista Unified
Middle
Roosevelt Middle · grades 6-8 · Vista Unified
High
Vista High · grades 9-12 · Vista Unified
The district's assigned schools for this parcel, from its attendance boundaries and rules. Boundaries change: confirm with the district before you buy.
Comparable Properties
5 comps foundThis Property
$2,872
Comp Average
$3,302

114 Buna Place
3bd / 2ba · 1,142 sqft · Single Family
$665K
Est. $3,336/mo

968 Marlin Drive
3bd / 2.5ba · 1,278 sqft · Single Family
$649K
Est. $3,359/mo

726 Windsor Court
3bd / 2ba · 1,279 sqft · Single Family
$780K
Est. $3,440/mo

710 Civic Center Drive
2bd / 1ba · 915 sqft · Single Family
$729K
Est. $2,899/mo

1205 Via
3bd / 2ba · 1,260 sqft · Single Family
$917K
Est. $3,478/mo
Comps based on same zip code, similar beds (±1), price range (60-150%).
Investment Score
9 leases of 1–3 bed houses within 2 mi · $2,641–$3,028
Blended 50/50 with a property-level estimate
Rent − PITIA
Incl. vacancy, PM, maint, capex
What would make this work?
$3,589/mo short at 20% down; 89% down or +$4,661/mo rent closes it.
- Break-even price
- $289,426
- Break-even rent
- $7,533/mo
- Cashflow at 35% down
- −$2,803/mo
- Down payment to break even
- 89%
- Rate to break even
- Not reachable
62% under asking
$4,661/mo above the estimate
$675,510 cash
Negative even at a 0% loan
Need ≥ 1.25 for DSCR loan
Lower = better for investors
* Modelled at 20% down, 7.36% rate, 30yr · vacancy 8% · PM 10% · capex 5% · maintenance 1%/yr.
Estimates only. Not financial advice. Verify all figures independently with a licensed professional before making any investment decision.
Open Full Calculator