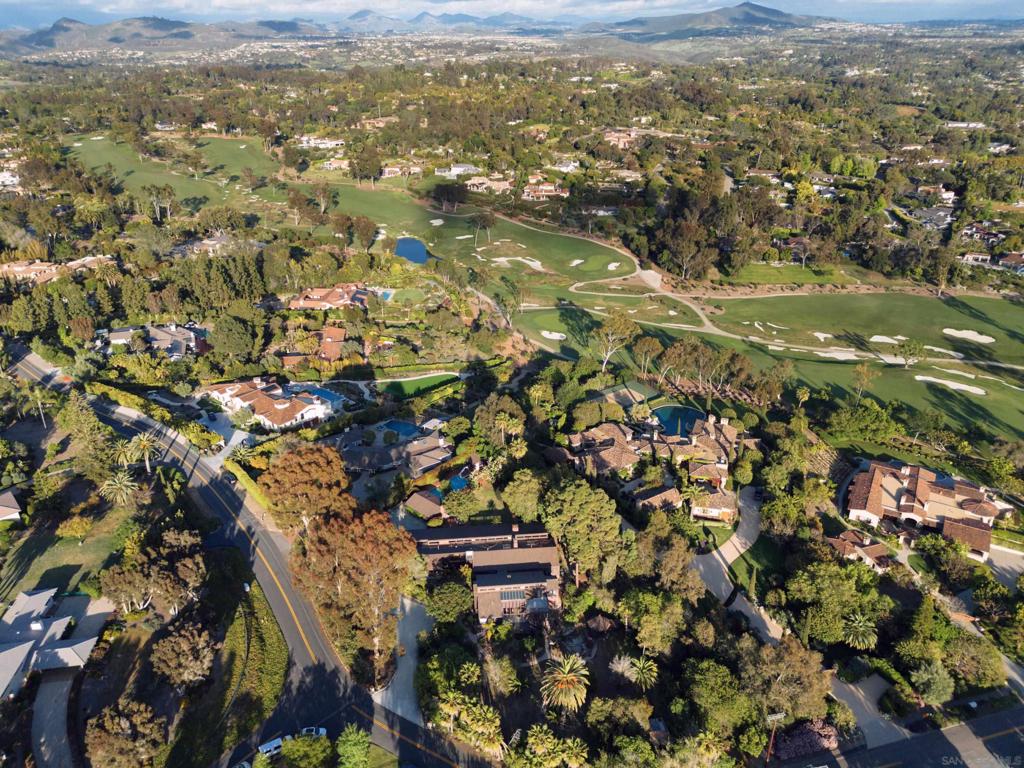
6009 Mimulus
Ctop 80%Rancho Santa Fe, CA 92067
HOA rules unknown: an HOA can ban stays under 30 days (Civ. Code §4741), and no permit on file shows this one allows them. Get the CC&Rs.
Pass at asking: -$21,476/mo full cashflow at 20% down, 7.43% rate.
Works at $1,453,795 (66% under asking), or at 93% down.
Rent $16,449/mo from 15 leases of houses within 1 mi, same school area, size-adjusted ($15,000–$21,020).
Beds
8
Baths
8
Sqft
8,281
Year Built
1952
Days on Market
239
Property Type
Single Family
HOA/mo
$1,500
MLS ID
260002525SD
This property is in Rancho Santa Fe (92067). Browse neighborhood analytics →
About This Property
Offering a wide array of possibilities, this expansive home is a short walk to the Village, Roger Rowe School, golf course, tennis courts, and clubhouse. This property hosts three distinct structures: a 4-bed, 4-bath home (built in 1952, remodeled in 1976); a 4-bed, 4-bath structure (built in the early 1990s) is connected via a breezeway, and a separate ~900 sq ft 1-bed, 1-bath guest house adjacent to the swimming pool. Resting amidst 1.3 acres the opportunities are varied - from restoring the original home to further expansion and remodeling of the multifamily-ready site to fully capture the landscape in this perfect Rancho Santa Fe Covenant setting.
Mortgage Calculator
Est. Monthly Payment
$30,600
Location
Loading map...
Zoned Schools
Elementary
R. Roger Rowe Elementary · grades PK-5 · Rancho Santa Fe Elementary
Middle
R. Roger Rowe Middle · grades 6-8 · Rancho Santa Fe Elementary
The district's assigned schools for this parcel, from its attendance boundaries and rules. Boundaries change: confirm with the district before you buy.
Comparable Properties
5 comps foundThis Property
$16,449
Comp Average
$17,345

18338 Avenida Apice
6bd / 6.5ba · 5,998 sqft · Single Family
$4.39M
Est. $28,638/mo

17854 Camino De La Mitra
6bd / 6.5ba · 6,234 sqft · Single Family
$4.39M
Est. $13,549/mo

6150 Avenida Alteras
6bd / 6ba · 6,640 sqft · Single Family
$4.97M
Est. $17,048/mo

6773 Poco Lago
7bd / 7.5ba · 8,342 sqft · Single Family
$5.95M
Est. $12,584/mo

16610 El Zorro
6bd / 6.5ba · 6,802 sqft · Single Family
$6.25M
Est. $14,908/mo
Comps based on same zip code, similar beds (±1), price range (60-150%).
Investment Score
15 leases of houses within 1 mi, same school area, size-adjusted · $15,000–$21,020
Rent − PITIA
Incl. vacancy, PM, maint, capex
What would make this work?
$21,476/mo short at 20% down; 93% down or +$27,892/mo rent closes it.
- Break-even price
- $1,453,795
- Break-even rent
- $44,341/mo
- Cashflow at 35% down
- −$17,049/mo
- Down payment to break even
- 93%
- Rate to break even
- Not reachable
66% under asking
$27,892/mo above the estimate
$3,952,500 cash
Negative even at a 0% loan
Need ≥ 1.25 for DSCR loan
Lower = better for investors
* Modelled at 20% down, 7.43% rate, 30yr · vacancy 8% · PM 10% · capex 5% · maintenance 1%/yr.
Estimates only. Not financial advice. Verify all figures independently with a licensed professional before making any investment decision.
Open Full Calculator