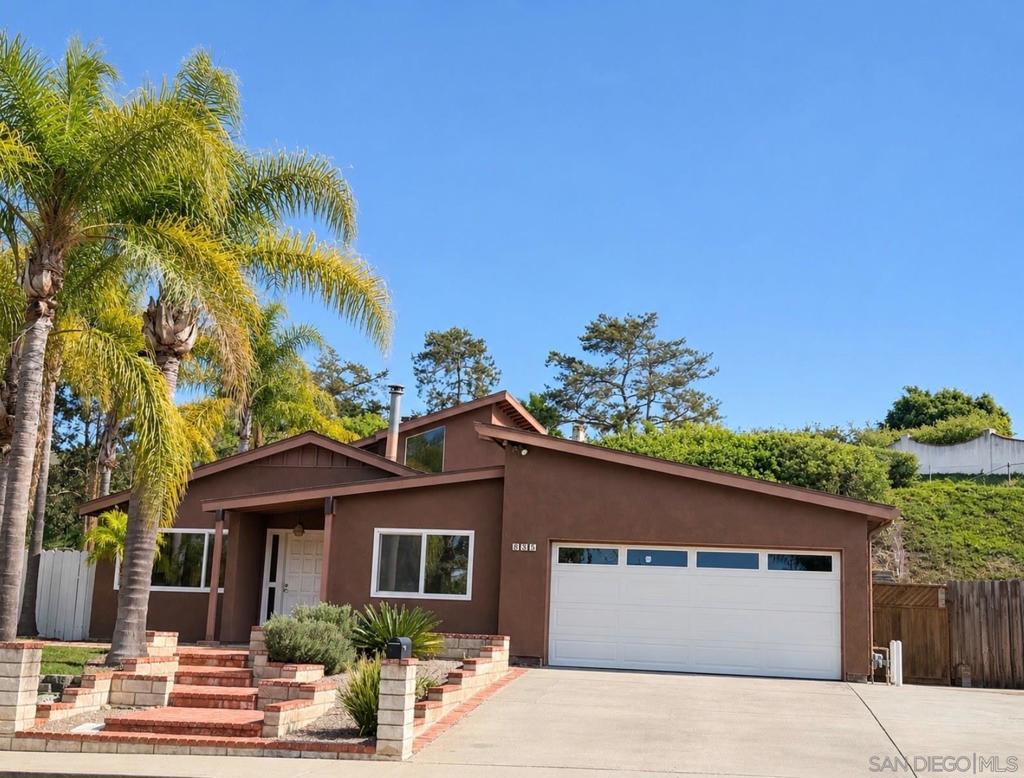
535 Tam O Shanter Dr
Btop 30%San Marcos, CA 92069
Pass at asking: -$3,123/mo full cashflow at 20% down, 7.43% rate.
Works at $493,340 (45% under asking), or at 70% down.
Rent $4,921/mo from 13 leases of 3–5 bed houses within 2 mi ($4,532–$5,253).
Beds
4
Baths
4
Sqft
2,481
Year Built
1974
Days on Market
0
Property Type
Single Family
HOA/mo
N/A
MLS ID
260026608SD
This property is in San Marcos (92069). View neighborhood stats →
About This Property
Exceptional Value, Large Lot & Endless Potential in San Marcos! Welcome to 535 Tam O Shanter Drive, an incredible opportunity for homeowners, investors, and buyers looking to build equity in a desirable San Marcos neighborhood. Situated on a generously sized lot, this property offers tremendous potential to customize, expand, and create something truly special. With a little vision and TLC, this AS-IS sale presents an exciting opportunity to unlock the property's full potential. The versatile floor plan offers for 4 bedrooms and 4 full bathrooms, plus an optional room that could accommodate a 5th bedroom. The expansive lot provides exciting possibilities for additional parking, including potential RV parking, outdoor entertaining, and exploring future development opportunities. Buyers may also investigate potential ADU construction, subject to applicable zoning, lot eligibility, setbacks, and City of San Marcos approvals. Conveniently located near shopping centers, grocery stores, restaurants, and everyday amenities, this property also offers access to the highly regarded San Marcos school district. Enjoy convenient connectivity to both the 78 and 15 freeways, making commuting throughout North County and greater San Diego a breeze. Don't miss the opportunity to make this San Marcos property your own!
Mortgage Calculator
Est. Monthly Payment
$6,162
Location
Loading map...
Renovation math
Flagged Fixer from the listing remarks — “tlc”, “as-is”, “endless potential”.
- Asking now
- $900K
- Worth finished
- $1.03M
- Budget to renovate
- $134,658
$363/sqft
$417/sqft × 2,481 sqft
$54/sqft to spend
Comparable finished homes nearby suggest this is worth $1.03M once it's brought to par — about $134,658 above the asking price. That spread is your renovation budget before the deal stops working.
Rent once renovated
- Rent at par
- $4,797/mo
- Cashflow at that rent
- −$3,218/mo
$1.93/sqft × 2,481 sqft, median of 5 comps
cap rate 2.70%, DSCR 0.78
Heads up: the rent estimate elsewhere on this page ($4,921/mo) is above what comparable finished homes here support. A home that needs work does not out-rent them, so treat $4,797/mo as the ceiling.
Buying at asking and achieving par rent, excluding the renovation spend itself. We don't publish a current-condition rent: no listing remark says how much work a home needs, and mid-renovation it earns nothing.
Based on 5 comparable homes of the same property type and size currently listed nearby — asking prices and modelled rents, not closed sales. A contractor's scope, not this page, decides what a renovation actually costs.
Comparable Properties
5 comps foundThis Property
$4,921
Comp Average
$4,806

1487 Palomarcos Avenue
5bd / 3ba · 2,530 sqft · Single Family
$970K
Est. $5,018/mo

1453 Via Dorado
4bd / 2.5ba · 2,278 sqft · Single Family
$950K
Est. $4,927/mo

893 Via La Venta
3bd / 3.5ba · 2,479 sqft · Single Family
$1.04M
Est. $4,609/mo

765 Helmsdale Rd
4bd / 3ba · 2,580 sqft · Single Family
$1.04M
Est. $4,634/mo

775 Old Oak Ridge
3bd / 2ba · 2,503 sqft · Single Family
$1.42M
Est. $4,840/mo
Comps based on same zip code, similar beds (±1), price range (60-150%).
Investment Score
13 leases of 3–5 bed houses within 2 mi · $4,532–$5,253
Blended 50/50 with the zip's market median ($4,970)
Rent − PITIA
Incl. vacancy, PM, maint, capex
What would make this work?
$3,123/mo short at 20% down; 70% down or +$4,055/mo rent closes it.
- Break-even price
- $493,340
- Break-even rent
- $8,976/mo
- Cashflow at 35% down
- −$2,185/mo
- Down payment to break even
- 70%
- Rate to break even
- Not reachable
45% under asking
$4,055/mo above the estimate
$629,999 cash
Negative even at a 0% loan
Need ≥ 1.25 for DSCR loan
Lower = better for investors
* Modelled at 20% down, 7.43% rate, 30yr · vacancy 8% · PM 10% · capex 5% · maintenance 1%/yr.
Estimates only. Not financial advice. Verify all figures independently with a licensed professional before making any investment decision.
Open Full Calculator