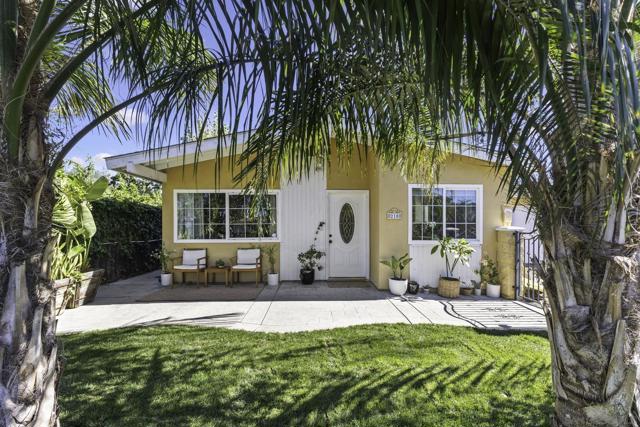
210 Hollenbeck Rd
Atop 10%San Marcos, CA 92069Neighborhood: Business/Industrial District
Pass at asking: -$2,081/mo full cashflow at 20% down, 7.36% rate.
Works at $352,630 (44% under asking), or at 69% down.
Rent $3,539/mo from 12 leases of 2–4 bed houses within 2 mi ($2,882–$3,523).
Beds
3
Baths
1
Sqft
1,027
Year Built
1972
Days on Market
1
Property Type
Single Family
HOA/mo
$30
MLS ID
260026936SD
This property is in San Marcos (92069). View neighborhood stats →
About This Property
Welcome to this inviting 3-bedroom twin home offering exceptional privacy, comfortable living, and a convenient coastal location. Attached to the neighboring property only at the garage, this twin home provides a sense of separation rarely found in attached housing. An additional bonus room offers flexible space for a home office, den, or other uses. Enjoy private front and back yards, including a fully enclosed backyard with newly installed sod and fruit trees--ideal for relaxing, entertaining, or enjoying the Southern California sunshine. Inside, you'll find brand-new flooring, a newer refrigerator and stove, central air conditioning, and a new water heater. Just 10 minutes from the beach, this home offers a wonderful combination of privacy, comfort, and convenience. The garage was converted into the third bedroom and bonus room many years ago by a prior owner.
Mortgage Calculator
Est. Monthly Payment
$4,286
Location
Loading map...
Zoned Schools
Elementary
La Mirada Academy · grades K-8 · San Marcos Unified
Middle
La Mirada Academy · grades K-8 · San Marcos Unified
High
San Marcos High · grades 9-12 · San Marcos Unified
The district's assigned schools for this parcel, from its attendance boundaries and rules. Boundaries change: confirm with the district before you buy.
Comparable Properties
5 comps foundThis Property
$3,539
Comp Average
$3,527

1537 Palomarcos
3bd / 2ba · 1,286 sqft · Single Family
$799K
Est. $3,647/mo

1788 Lindsley Park Drive
3bd / 2ba · 1,080 sqft · Single Family
$800K
Est. $3,720/mo

838 Loganberry Court
3bd / 2ba · 1,029 sqft · Single Family
$739K
Est. $3,276/mo

827 Bayberry Ct.
3bd / 2ba · 1,057 sqft · Single Family
$799K
Est. $3,507/mo

1649 Palomar Drive
3bd / 2ba · 1,257 sqft · Single Family
$834K
Est. $3,485/mo
Comps based on same zip code, similar beds (±1), price range (60-150%).
Short-term not available here. San Marcos does not allow short-term rentals in residential zones. See the rules
Investment Score
12 leases of 2–4 bed houses within 2 mi · $2,882–$3,523
Blended 50/50 with the zip's market median ($4,075)
Rent − PITIA
Incl. vacancy, PM, maint, capex
What would make this work?
$2,081/mo short at 20% down; 69% down or +$2,703/mo rent closes it.
- Break-even price
- $352,630
- Break-even rent
- $6,242/mo
- Cashflow at 35% down
- −$1,435/mo
- Down payment to break even
- 69%
- Rate to break even
- Not reachable
44% under asking
$2,703/mo above the estimate
$431,250 cash
Negative even at a 0% loan
Need ≥ 1.25 for DSCR loan
Lower = better for investors
* Modelled at 20% down, 7.36% rate, 30yr · vacancy 8% · PM 10% · capex 5% · maintenance 1%/yr.
Estimates only. Not financial advice. Verify all figures independently with a licensed professional before making any investment decision.
Open Full Calculator