Where San Diego Rents Rose Most: Encinitas Houses Up 17% in a Year (October 2026)
We compared every closed MLS lease in San Diego County from November 2025 to October 2026 (4,262 leases) with the 12 months before (4,311 leases), per square foot, so a bigger home doesn't read as a raise. House rents went from $2.88 to $2.92 a square foot a month (2,032 leases, then 2,000), flat at +1%, and the median house leased for $4,798 this year. Condo and townhome rents went from $3.20 to $3.17 a square foot a month (2,279 leases, then 2,262), flat at -1%, and the median condo or townhome leased for $3,300 this year.
Of the 26 zip codes and kinds of home with at least 40 leases in both years, 14 rose more than 2%, 11 held within 2% and 1 fell.
Where rents rose most
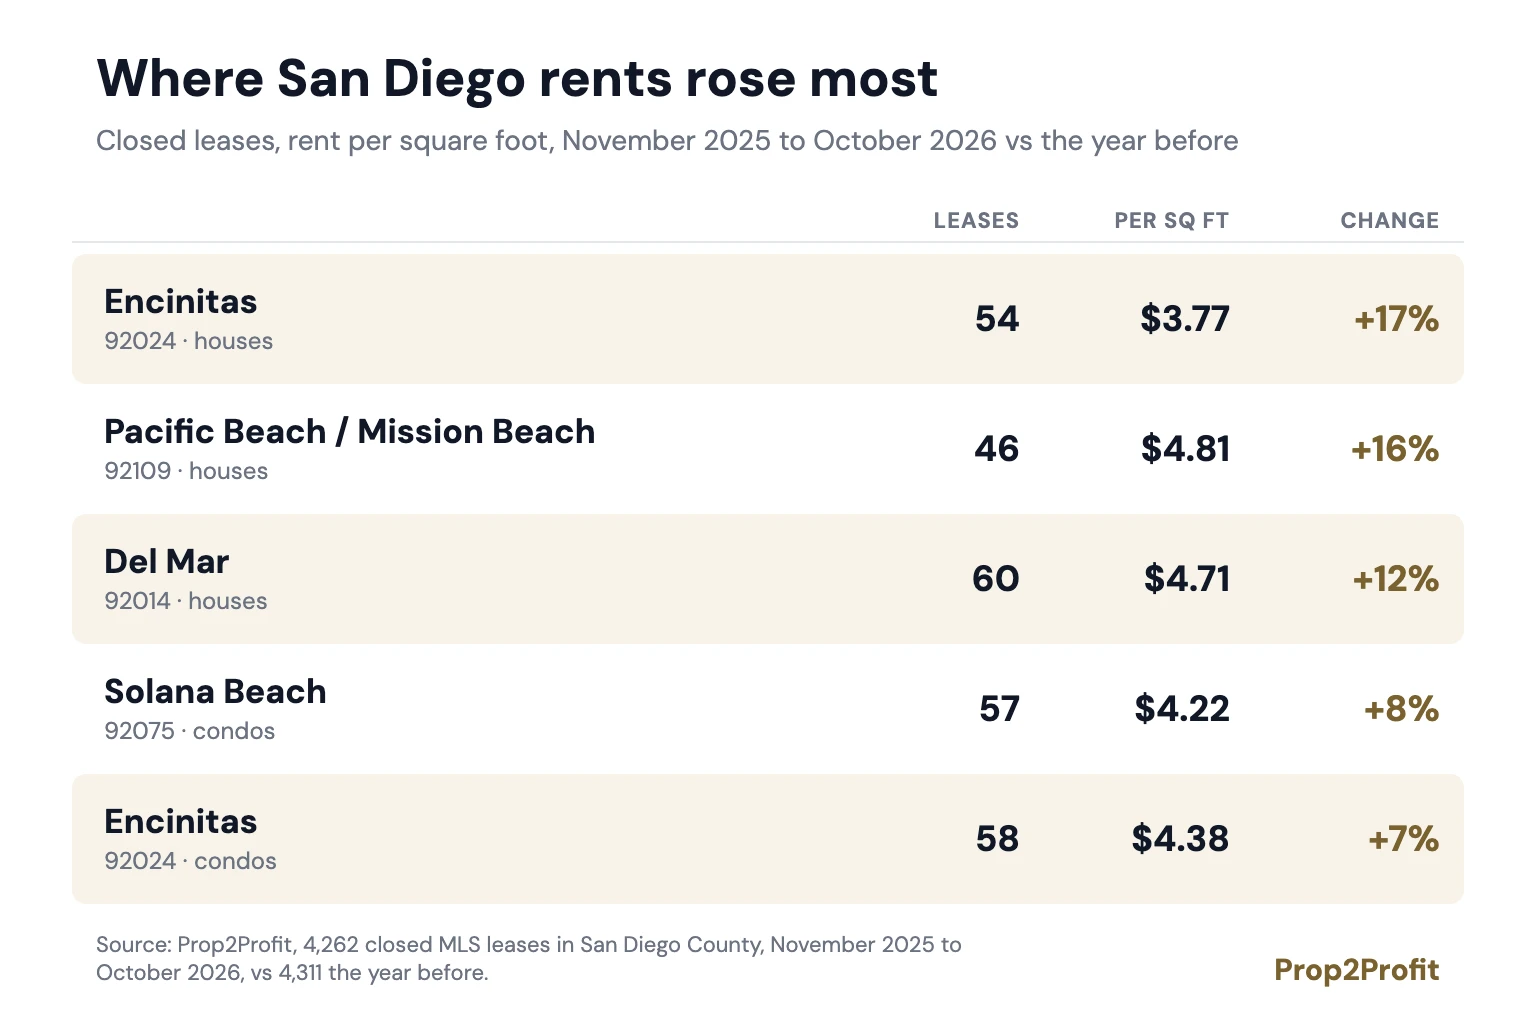
- Encinitas (92024) houses: $3.23 to $3.77 a square foot (60 leases, then 54), up 17%. The median lease this year was $6,900 for 1,868 sq ft.
- Pacific Beach / Mission Beach (92109) houses: $4.15 to $4.81 a square foot (51 leases, then 46), up 16%. The median lease this year was $5,800 for 1,216 sq ft.
- Del Mar (92014) houses: $4.20 to $4.71 a square foot (69 leases, then 60), up 12%. The median lease this year was $10,000 for 2,256 sq ft.
- Solana Beach (92075) condos and townhomes: $3.89 to $4.22 a square foot (49 leases, then 57), up 8%. The median lease this year was $5,450 for 1,242 sq ft.
- Encinitas (92024) condos and townhomes: $4.11 to $4.38 a square foot (62 leases, then 58), up 7%. The median lease this year was $3,925 for 936 sq ft.
- Clairemont (92117) houses: $3.41 to $3.63 a square foot (44 leases, then 42), up 6%. The median lease this year was $4,448 for 1,281 sq ft.
Where rents held flat or fell
- San Marcos (92078) houses: $2.14 to $2.07 a square foot (48 leases, then 42), down 3%. The median lease this year was $4,875 for 2,144 sq ft.
- Hillcrest / Mission Hills (92103) condos and townhomes: $3.40 to $3.36 a square foot (67 leases, then 79), flat at -1%. The median lease this year was $3,000 for 810 sq ft.
- University City (92122) condos and townhomes: $3.32 to $3.29 a square foot (78 leases, then 73), flat at -1%. The median lease this year was $3,475 for 1,054 sq ft.
- Rancho Penasquitos (92129) houses: $2.41 to $2.39 a square foot (43 leases, then 50), flat at -1%. The median lease this year was $5,000 for 2,253 sq ft.
- Mira Mesa (92126) condos and townhomes: $2.99 to $2.98 a square foot (57 leases, then 44), flat at 0%. The median lease this year was $2,850 for 920 sq ft.
Every area we could compare
| Area | Home | Leases (last year, this year) | Rent per sq ft | Change |
|---|---|---|---|---|
| Encinitas (92024) | houses | 60, 54 | $3.23 to $3.77 | +17% |
| Pacific Beach / Mission Beach (92109) | houses | 51, 46 | $4.15 to $4.81 | +16% |
| Del Mar (92014) | houses | 69, 60 | $4.20 to $4.71 | +12% |
| Solana Beach (92075) | condos | 49, 57 | $3.89 to $4.22 | +8% |
| Encinitas (92024) | condos | 62, 58 | $4.11 to $4.38 | +7% |
| Clairemont (92117) | houses | 44, 42 | $3.41 to $3.63 | +6% |
| La Jolla (92037) | houses | 156, 154 | $4.23 to $4.49 | +6% |
| Rancho Santa Fe (92067) | houses | 56, 41 | $3.59 to $3.80 | +6% |
| 4S Ranch (92127) | houses | 43, 52 | $2.32 to $2.46 | +6% |
| Rancho Bernardo (92128) | condos | 76, 72 | $2.79 to $2.94 | +5% |
| Carlsbad / La Costa (92009) | houses | 55, 50 | $2.48 to $2.62 | +5% |
| Carmel Valley (92130) | condos | 98, 85 | $3.19 to $3.31 | +4% |
| Carmel Valley (92130) | houses | 103, 73 | $2.62 to $2.68 | +2% |
| Mission Valley (92108) | condos | 50, 57 | $3.07 to $3.14 | +2% |
| North Park (92104) | condos | 52, 41 | $3.79 to $3.85 | +1% |
| Carlsbad / La Costa (92009) | condos | 51, 42 | $2.66 to $2.69 | +1% |
| Pacific Beach / Mission Beach (92109) | condos | 65, 49 | $4.14 to $4.19 | +1% |
| Downtown San Diego (92101) | condos | 306, 311 | $3.53 to $3.57 | +1% |
| Oceanside (Coastal) (92054) | condos | 45, 47 | $3.26 to $3.29 | +1% |
| La Jolla (92037) | condos | 158, 141 | $3.77 to $3.79 | +1% |
| Oceanside (92057) | houses | 51, 59 | $2.09 to $2.09 | 0% |
| Mira Mesa (92126) | condos | 57, 44 | $2.99 to $2.98 | 0% |
| Rancho Penasquitos (92129) | houses | 43, 50 | $2.41 to $2.39 | -1% |
| University City (92122) | condos | 78, 73 | $3.32 to $3.29 | -1% |
| Hillcrest / Mission Hills (92103) | condos | 67, 79 | $3.40 to $3.36 | -1% |
| San Marcos (92078) | houses | 48, 42 | $2.14 to $2.07 | -3% |
Do better schools mean higher rent?
We matched 3,989 leases of the last 12 months (to November 5, 2026) to the elementary school that serves each address (the zoned school where the district publishes its zones, else the nearest school in the district) and that school's CAASPP 2025 county percentile.
Houses in the top fifth of schools leased for a median $6,490, against $3,500 in the bottom fifth. Most of that gap is the house itself: the top school houses were bigger (2,173 sq ft against 1,261) and closer to the ocean (4.8 km against 11.3 km). Per square foot they rented for $3.04 against $2.83.
Holding the size and the distance to the coast the same, every 10 points of school percentile went with about 2.6% more rent for a house (11% before we held them). That makes a house in a top fifth school area rent about 24% more than one of the same size, the same distance from the coast, in a bottom fifth area. For condos and townhomes the link is weak: 0.5% per 10 points, about 4% from the bottom fifth to the top.
Better schools travel with other things renters pay for, like newer homes and quieter streets, so read this as what the market pays alongside a better school, not for the school alone.
By school district, for houses (the 17 districts with at least 25 house leases), the school score and the rent per square foot move together only loosely. Del Mar Union Elementary and Rancho Santa Fe Elementary score high and rent high, $3.33 and $3.87 a square foot. Carlsbad Unified and Poway Unified score high too but rent for $2.64 and $2.42, below the middle of these districts ($2.66). South Bay Union scores low but rents for $2.90, 1.7 km from the coast.
| School district | House leases | School percentile | Median rent | Rent per sq ft |
|---|---|---|---|---|
| Del Mar Union Elementary | 101 | 98 | $7,900 | $3.33 |
| Rancho Santa Fe Elementary | 30 | 97 | $12,998 | $3.87 |
| Carlsbad Unified | 81 | 93 | $5,795 | $2.64 |
| Poway Unified | 165 | 90 | $4,995 | $2.42 |
| Cardiff Elementary | 26 | 87 | $8,000 | $4.91 |
| Solana Beach Elementary | 82 | 87 | $8,975 | $3.68 |
| Coronado Unified | 31 | 85 | $8,000 | $4.17 |
| San Marcos Unified | 82 | 84 | $4,850 | $2.24 |
| Encinitas Union Elementary | 75 | 80 | $7,000 | $3.30 |
| San Diego Unified | 642 | 79 | $4,675 | $3.41 |
| Chula Vista Elementary | 143 | 68 | $4,500 | $2.28 |
| Bonsall Unified | 27 | 55 | $5,000 | $1.65 |
| Vista Unified | 75 | 53 | $4,195 | $2.49 |
| La Mesa-Spring Valley | 45 | 44 | $4,200 | $2.66 |
| Oceanside Unified | 83 | 40 | $4,200 | $2.57 |
| Escondido Union | 57 | 27 | $4,250 | $2.37 |
| South Bay Union | 35 | 18 | $3,500 | $2.90 |
What it means for investors
At today's prices and rates, a San Diego rental leans on rent growth more than on cash flow at the start, so where rents are rising matters as much as where they begin. The strongest gains this year were in Encinitas houses. A change of a few percent in one area is within the noise of who happened to lease that year, so look for a rise that shows up in more than one area or more than one year before you count on it. You can see what any home for sale would rent for, from its own closed leases, on every listing, or compare areas on our neighborhoods page.
How we figured it
Closed MLS leases (CRMLS) of houses, condos and townhomes in San Diego County, November 2024 to October 2025 against November 2025 to October 2026. A lease labeled a single family home but carrying a unit number counts as a condo or townhome. The measure is the median rent per square foot in each year, for each zip code and kind of home with at least 40 leases in both years. A change within 2% is called flat. A median of about 50 leases moves with the mix of homes that happened to lease, so treat a change under about 5% as noise. School scores are the California Department of Education's CAASPP 2025 results (the share of students meeting the standard in English and math), ranked against every elementary school in the county. The school study is an ordinary least squares fit of the log of the rent on the school percentile, the log of the distance to the coast and the log of the size.
- San Diego
- rent growth
- rents
- schools
- market data