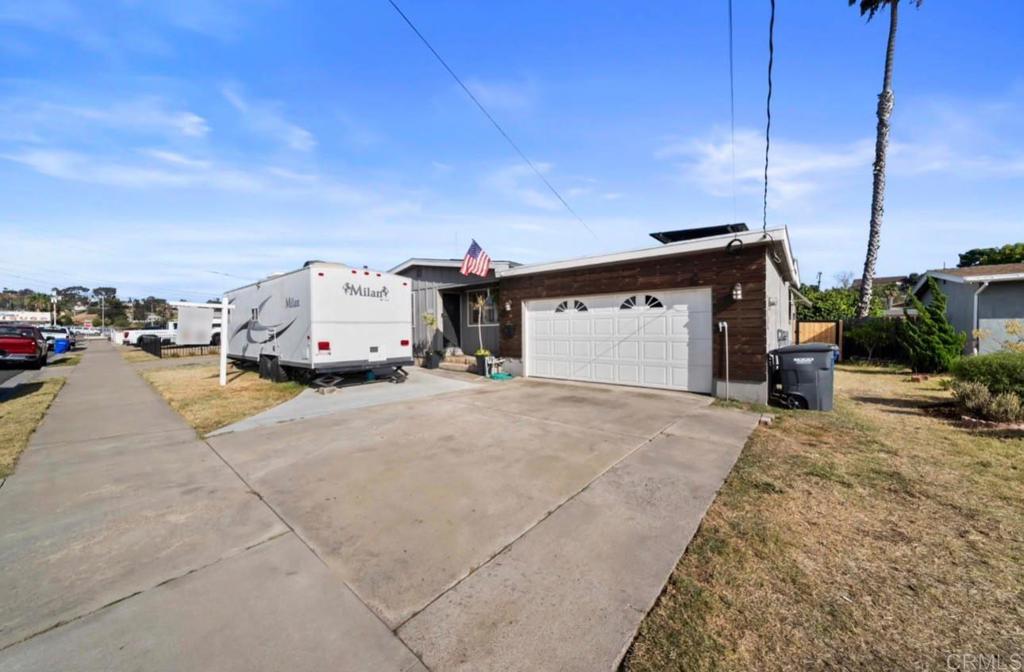
3002 11th Street
Btop 30%National City, CA 91950
Pass at asking: -$2,738/mo full cashflow at 20% down, 7.43% rate.
Works at $389,541 (48% under asking), or at 73% down.
Rent $3,886/mo from 18 leases of 3-bed houses within 2 mi ($4,068–$4,460).
Beds
3
Baths
2
Sqft
1,648
Year Built
1965
Days on Market
104
Property Type
Single Family
HOA/mo
N/A
MLS ID
PTP2605727
This property is in National City (91950). Browse neighborhood analytics →
About This Property
Discover the possibilities at 3002 E 11th St, National City! This well-positioned property offers a versatile layout with comfortable living spaces, abundant natural light, and a functional floor plan designed for everyday living. The spacious lot provides room to relax, entertain, or explore future outdoor enhancements. Conveniently located near shopping, dining, schools, parks, major freeways, and public transportation, this home offers easy access to everything National City and the surrounding areas have to offer. Whether you're looking for a primary residence or an investment opportunity, this property presents exceptional potential in a centrally located neighborhood. Don't miss your chance to make it your own!
Mortgage Calculator
Est. Monthly Payment
$5,108
Location
Loading map...
Zoned Schools
Elementary
Palmer Way · grades K-6 · National Elementary
Middle
Granger Junior High · grades 7-9 · Sweetwater Union High
High
Sweetwater High · grades 9-12 · Sweetwater Union High
The district's assigned schools for this parcel, from its attendance boundaries and rules. Boundaries change: confirm with the district before you buy.
Comparable Properties
5 comps foundThis Property
$3,886
Comp Average
$4,002

2121 4th Street
3bd / 2ba · 1,528 sqft · Single Family
$750K
Est. $4,247/mo
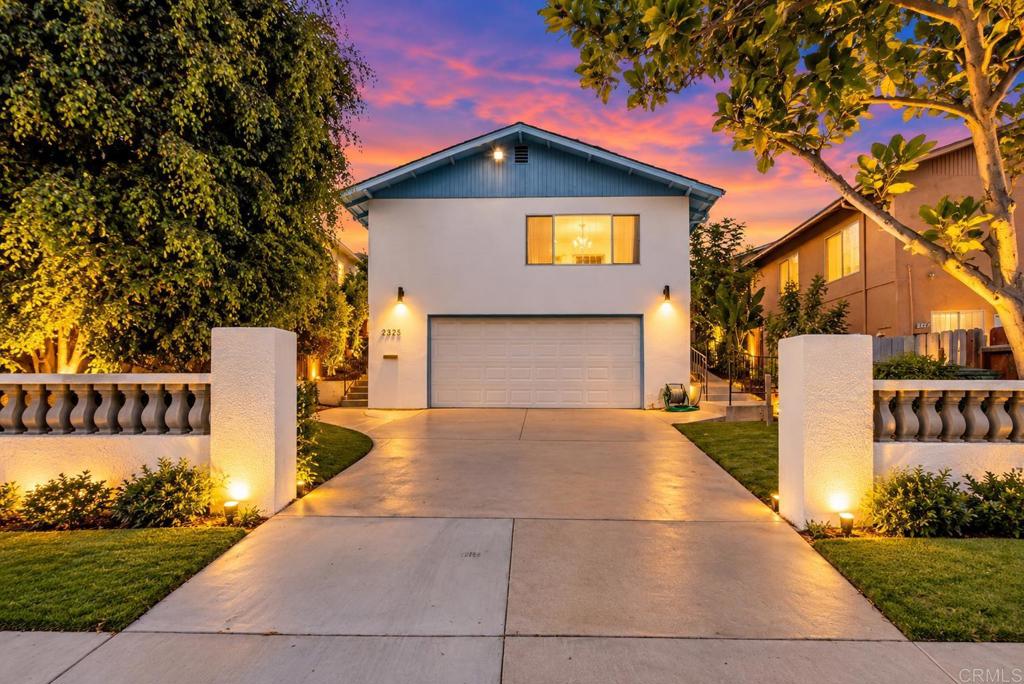
2325 14th Street
3bd / 2ba · 1,514 sqft · Single Family
$749K
Est. $3,925/mo

3140 2nd Street
3bd / 2ba · 1,565 sqft · Single Family
$810K
Est. $4,021/mo

1003 Manchester Street
3bd / 2ba · 1,802 sqft · Single Family
$850K
Est. $4,041/mo

2628 Fenton Pl
3bd / 2.5ba · 1,376 sqft · Single Family
$880K
Est. $3,774/mo
Comps based on same zip code, similar beds (±1), price range (60-150%).
Investment Score
18 leases of 3-bed houses within 2 mi · $4,068–$4,460
Blended 50/50 with a property-level estimate
Rent − PITIA
Incl. vacancy, PM, maint, capex
What would make this work?
$2,738/mo short at 20% down; 73% down or +$3,556/mo rent closes it.
- Break-even price
- $389,541
- Break-even rent
- $7,442/mo
- Cashflow at 35% down
- −$1,961/mo
- Down payment to break even
- 73%
- Rate to break even
- Not reachable
48% under asking
$3,556/mo above the estimate
$544,580 cash
Negative even at a 0% loan
Need ≥ 1.25 for DSCR loan
Lower = better for investors
* Modelled at 20% down, 7.43% rate, 30yr · vacancy 8% · PM 10% · capex 5% · maintenance 1%/yr.
Estimates only. Not financial advice. Verify all figures independently with a licensed professional before making any investment decision.
Open Full Calculator