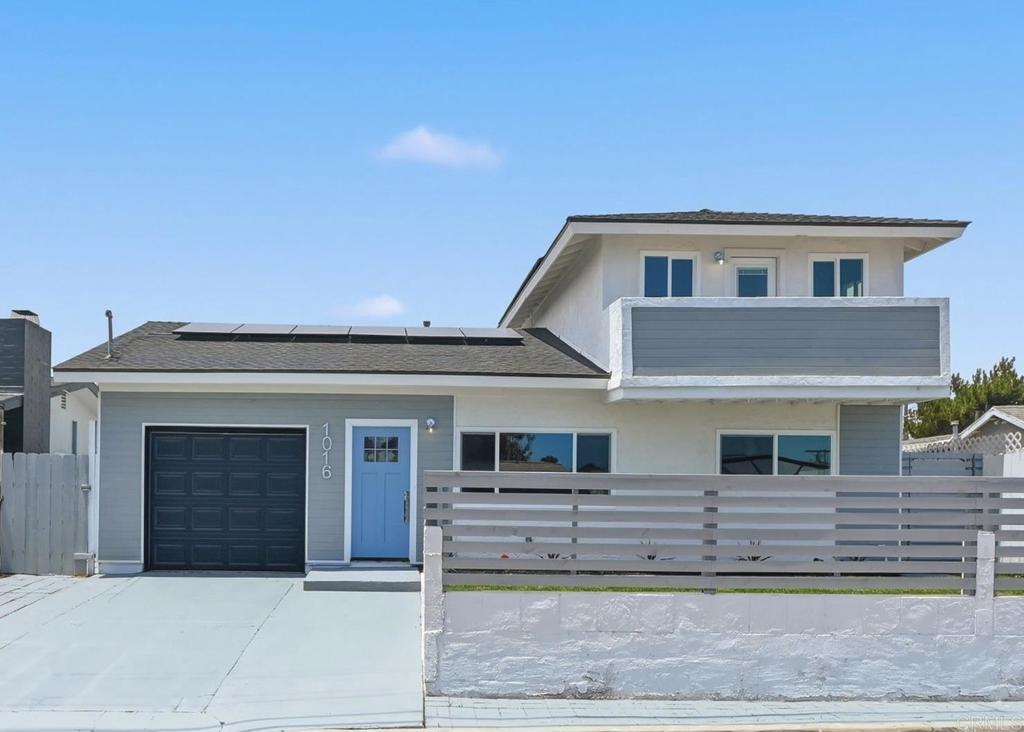
1016 Delaware St
Ctop 80%Imperial Beach, CA 91932
Pass at asking: -$5,206/mo full cashflow at 20% down, 7.43% rate.
Works at $419,201 (62% under asking), or at 89% down.
Rent $4,181/mo from 8 leases of 3–5 bed houses within 0.5 mi ($4,153–$4,697).
Beds
4
Baths
2.5
Sqft
1,799
Year Built
1969
Days on Market
110
Property Type
Single Family
HOA/mo
N/A
MLS ID
PTP2605563
This property is in Imperial Beach (91932). Browse neighborhood analytics →
About This Property
Welcome to your fully renovated coastal retreat in the heart of Imperial Beach! This beautifully updated home blends modern design with effortless indoor-outdoor living, just minutes from the beach. The open-concept floor plan features a stunning new kitchen with contemporary finishes, new flooring throughout, and beautifully remodeled bathrooms. A dramatic folding glass door seamlessly connects the living space to the outdoor entertaining area, creating the perfect setting for enjoying Southern California's coastal lifestyle. Take in breathtaking sunsets from the rooftop patio, offering an ideal space to relax or entertain. Conveniently located near the beach, local dining, shops, and parks, this move-in-ready home delivers the best of modern coastal living.
Mortgage Calculator
Est. Monthly Payment
$7,511
Location
Loading map...
Zoned Schools
Elementary
Imperial Beach Charter · grades K-8 · South Bay Union
Middle
Mar Vista Academy · grades 7-8 · Sweetwater Union High
High
Mar Vista Senior High · grades 9-12 · Sweetwater Union High
The district's assigned schools for this parcel, from its attendance boundaries and rules. Boundaries change: confirm with the district before you buy.
Comparable Properties
5 comps foundThis Property
$4,181
Comp Average
$4,417

946 11th
4bd / 2.5ba · 1,933 sqft · Single Family
$745K
Est. $4,535/mo

857 Holly Ave
4bd / 2ba · 1,868 sqft · Single Family
$850K
Est. $4,339/mo

558 11th St
4bd / 3ba · 1,643 sqft · Single Family
$890K
Est. $4,279/mo

1165 East Lane
4bd / 2ba · 1,850 sqft · Single Family
$960K
Est. $4,488/mo

466 Calla Ave
4bd / 2ba · 2,000 sqft · Single Family
$1.25M
Est. $4,442/mo
Comps based on same zip code, similar beds (±1), price range (60-150%).
Investment Score
8 leases of 3–5 bed houses within 0.5 mi · $4,153–$4,697
Blended 50/50 with a property-level estimate
Rent − PITIA
Incl. vacancy, PM, maint, capex
What would make this work?
$5,206/mo short at 20% down; 89% down or +$6,761/mo rent closes it.
- Break-even price
- $419,201
- Break-even rent
- $10,942/mo
- Cashflow at 35% down
- −$4,063/mo
- Down payment to break even
- 89%
- Rate to break even
- Not reachable
62% under asking
$6,761/mo above the estimate
$976,330 cash
Negative even at a 0% loan
Need ≥ 1.25 for DSCR loan
Lower = better for investors
* Modelled at 20% down, 7.43% rate, 30yr · vacancy 8% · PM 10% · capex 5% · maintenance 1%/yr.
Estimates only. Not financial advice. Verify all figures independently with a licensed professional before making any investment decision.
Open Full Calculator