6502 Oceanview
Dbottom 20%Carlsbad, CA 92011
Pass at asking: -$11,080/mo full cashflow at 20% down, 7.43% rate.
Works at $506,295 (74% under asking); even all cash loses money at asking.
Rent $5,557/mo from 9 leases of 3-bed houses within 2 mi ($5,017–$5,783).
Beds
3
Baths
2
Sqft
1,500
Year Built
2003
Days on Market
0
Property Type
Single Family
HOA/mo
$390
MLS ID
260026557SD
This property is in Carlsbad (92011). View neighborhood stats →
About This Property
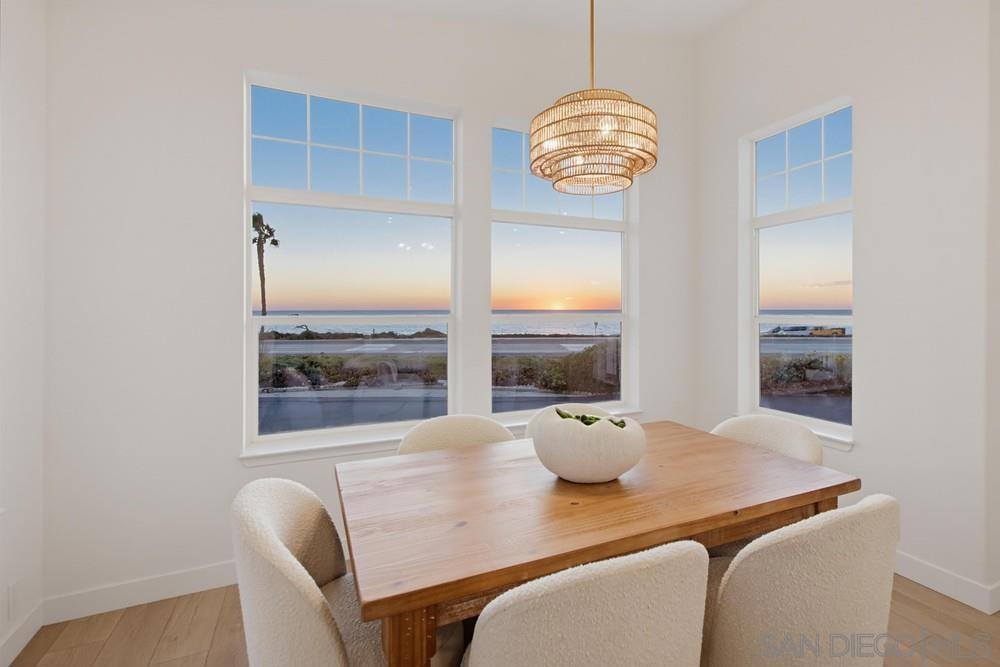
If a picture is worth a thousand words than this indescribable sit down panoramic view is worth millions! Welcome home to this stunning detached waterfront home on one of the largest lots in gated Solamar. This home has been completely reimagined including new cabinets, counters, designer tile and flooring. Stunning views from your open concept great room with vaulted ceilings, cozy fireplace, bar seating, dining, living, large kitchen and optional office/den/3rd bed and separate 450 sf roof top deck make this a show stopper. The spacious primary suite features 2 walk in closets, vaulted ceilings, and a large spa like bathroom. The home in beloved South Carlsbad is steps to the beach, has 3 off street parking spots, and the community features a gated entry, pool, pickleball court, and clubhouse all with low HOA fees. Homes with this unbeatable view don't come around often. Don't miss it!
Mortgage Calculator
Est. Monthly Payment
$13,735
Location
Loading map...
Comparable Properties
5 comps foundThis Property
$5,557
Comp Average
$5,111

6805 Watercourse Dr
3bd / 2.5ba · 1,700 sqft · Single Family
$1.70M
Est. $5,752/mo

7049 Surfbird Circle
3bd / 2.5ba · 1,705 sqft · Single Family
$1.60M
Est. $5,281/mo

1613 Brome Court
3bd / 2.5ba · 1,728 sqft · Single Family
$1.33M
Est. $4,885/mo

7302 Lantana Terrace
2bd / 2ba · 1,357 sqft · Single Family
$1.45M
Est. $4,807/mo

7327 Linden
2bd / 2ba · 1,265 sqft · Single Family
$1.70M
Est. $4,828/mo
Comps based on same zip code, similar beds (±1), price range (60-150%).
Investment Score
9 leases of 3-bed houses within 2 mi · $5,017–$5,783
Blended 50/50 with the zip's market median ($5,518)
Rent − PITIA
Incl. vacancy, PM, maint, capex
What would make this work?
$11,080/mo short at 20% down; +$14,389/mo rent closes it.
- Break-even price
- $506,295
- Break-even rent
- $19,946/mo
- Cashflow at 35% down
- −$9,050/mo
- Down payment to break even
- Not reachable
- Rate to break even
- Not reachable
74% under asking
$14,389/mo above the estimate
Negative even all-cash
Negative even at a 0% loan
Need ≥ 1.25 for DSCR loan
Lower = better for investors
* Modelled at 20% down, 7.43% rate, 30yr · vacancy 8% · PM 10% · capex 5% · maintenance 1%/yr.
Estimates only. Not financial advice. Verify all figures independently with a licensed professional before making any investment decision.
Open Full Calculator