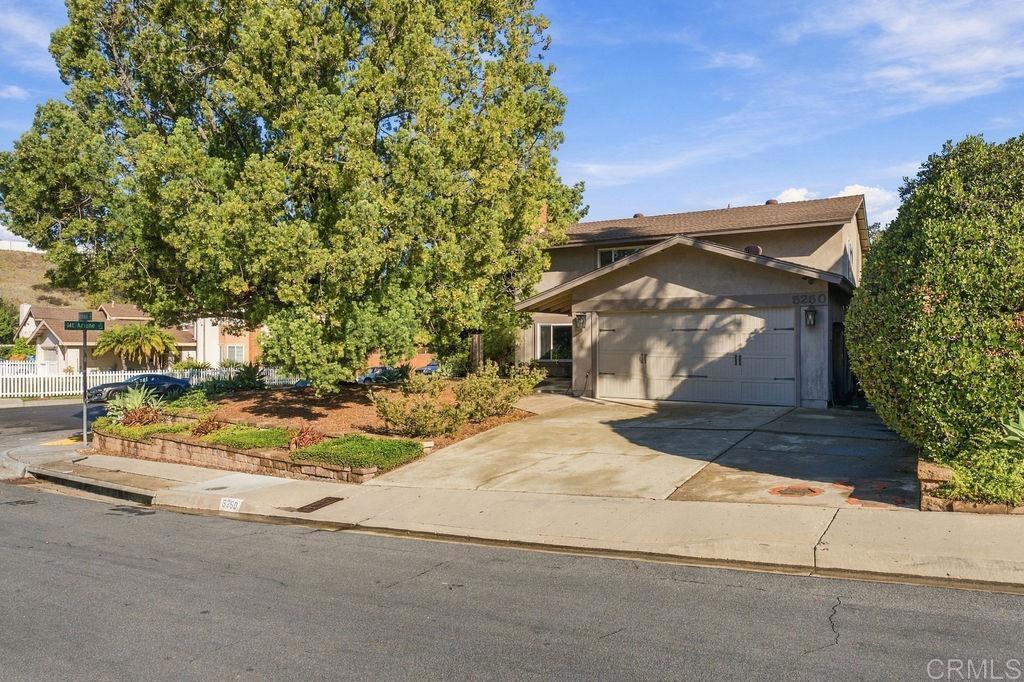
5250 Mount Burnham Drive
Ctop 80%San Diego, CA 92111
One license per person in San Diego: whether you can hold it depends on you, not only the home.
17 licensed short-term rentals within ½ mile (9 whole home), from the cities' license and permit lists of Nov 17, 2026.
Pass at asking: -$5,072/mo full cashflow at 20% down, 7.36% rate.
Works at $586,404 (53% under asking), or at 79% down.
Rent $5,820/mo from 13 leases of 4–6 bed houses within 2 mi ($5,692–$7,241).
Beds
5
Baths
2.5
Sqft
2,140
Year Built
1973
Days on Market
0
Property Type
Single Family
HOA/mo
N/A
MLS ID
PTP2608439
This property is in San Diego (92111). Browse neighborhood analytics →
About This Property
Fabulous Opportunity in Clairemont’s Sought-After “Mountain Street” Neighborhood! First time on the market in 30 years, this spacious two-story home offers a wonderful opportunity to make it your own. The thoughtfully designed floor plan features four bedrooms and two full baths upstairs, plus an additional bedroom and half bath on the main level. Enjoy a welcoming layout with an updated kitchen, formal living room, separate dining room, and a comfortable family room conveniently located adjacent to the kitchen. Situated on a desirable corner lot, the property is graced by a lovely podocarpus tree in the front yard. The spacious backyard offers plenty of possibilities for outdoor entertaining and enjoying the quintessential Southern California lifestyle. Additional features include a two-car attached garage with laundry. Trust Sale. Property to be conveyed in its present “AS IS” condition.
Mortgage Calculator
Est. Monthly Payment
$8,511
Location
Loading map...
Zoned Schools
Elementary
Holmes Elementary · grades K-5 · San Diego Unified
Middle
Marston Middle · grades 6-8 · San Diego Unified
High
Clairemont High · grades 9-12 · San Diego Unified
The district's assigned schools for this parcel, from its attendance boundaries and rules. Boundaries change: confirm with the district before you buy.
Renovation math
Flagged Light Value-Add from the listing remarks — “trust sale”, “as is”, “make it your own”.
- Asking now
- $1.25M
- Worth finished
- $1.38M
- Budget to renovate
- $126,608
$584/sqft
$643/sqft × 2,140 sqft
$59/sqft to spend
Comparable finished homes nearby suggest this is worth $1.38M once it's brought to par — about $126,608 above the asking price. That spread is your renovation budget before the deal stops working.
Rent once renovated
- Rent at par
- $5,735/mo
- Cashflow at that rent
- −$5,137/mo
$2.68/sqft × 2,140 sqft, median of 5 comps
cap rate 1.96%, DSCR 0.67
Heads up: the rent estimate elsewhere on this page ($5,820/mo) is above what comparable finished homes here support. A home that needs work does not out-rent them, so treat $5,735/mo as the ceiling.
Buying at asking and achieving par rent, excluding the renovation spend itself. We don't publish a current-condition rent: no listing remark says how much work a home needs, and mid-renovation it earns nothing.
Based on 5 comparable homes of the same property type and size currently listed nearby — asking prices and modelled rents, not closed sales. A contractor's scope, not this page, decides what a renovation actually costs.
Comparable Properties
5 comps foundThis Property
$5,820
Comp Average
$5,173

3825 Tiara St
5bd / 2ba · 1,710 sqft · Single Family
$1.10M
Est. $4,999/mo

7209 Courtney Dr
6bd / 4ba · 2,382 sqft · Single Family
$1.35M
Est. $6,046/mo

6590 High Knoll
4bd / 2.5ba · 1,687 sqft · Single Family
$1.20M
Est. $5,013/mo

5442 Burford Street
4bd / 2ba · 2,053 sqft · Single Family
$1.54M
Est. $5,502/mo
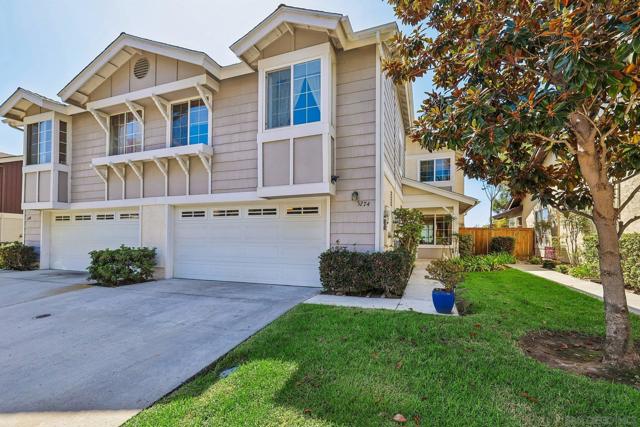
3274 Old Heather Rd
4bd / 3ba · 2,061 sqft · Single Family
$1.19M
Est. $4,307/mo
Comps based on same zip code, similar beds (±1), price range (60-150%).
Investment Score
13 leases of 4–6 bed houses within 2 mi · $5,692–$7,241
Blended 50/50 with a property-level estimate
Rent − PITIA
Incl. vacancy, PM, maint, capex
What would make this work?
$5,072/mo short at 20% down; 79% down or +$6,587/mo rent closes it.
- Break-even price
- $586,404
- Break-even rent
- $12,407/mo
- Cashflow at 35% down
- −$3,779/mo
- Down payment to break even
- 79%
- Rate to break even
- Not reachable
53% under asking
$6,587/mo above the estimate
$987,500 cash
Negative even at a 0% loan
Need ≥ 1.25 for DSCR loan
Lower = better for investors
* Modelled at 20% down, 7.36% rate, 30yr · vacancy 8% · PM 10% · capex 5% · maintenance 1%/yr.
Estimates only. Not financial advice. Verify all figures independently with a licensed professional before making any investment decision.
Open Full Calculator