
521 Calle Montecito
Atop 10%Oceanside, CA 92057Neighborhood: North Valley
3 licensed short-term rentals within ½ mile (3 whole home), from the cities' license and permit lists of Nov 17, 2026.
Pass at asking: -$1,362/mo full cashflow at 20% down, 7.36% rate.
Works at $189,749 (48% under asking), or at 74% down.
Rent $2,688/mo from 12 leases of 2-bed condos & townhomes within 1 mi ($2,334–$2,652).
Beds
2
Baths
1
Sqft
806
Year Built
1985
Days on Market
0
Property Type
Condo
HOA/mo
$620
MLS ID
NDP2610322
This property is in Oceanside (92057). Browse neighborhood analytics →
About This Property
End unit Condo and no one above! This unit is pool side with a Fantastic view of sparkling water. Features 2 bedrooms with 1 bath. This was a second home with 3 visits per year and inside is pristine. Owner will convey ALL furnishings which includes washer and dryer that means you will enjoy turn-key living. Covered parking, pool, hot tub and clubhouse. HOA dues cover water, trash, and the community's landscaping maintenance. Walk to nearby park and trails. Minutes to beach, eateries, Camp Pendleton's back gate, entertainment centers including movie theaters and golf, mall and EZ access to freeways.
Mortgage Calculator
Est. Monthly Payment
$3,126
Location
Loading map...
Zoned Schools
Elementary
Libby Elementary · grades K-5 · Oceanside Unified
Middle
Cesar Chavez Middle · grades 6-8 · Oceanside Unified
High
El Camino High · grades 9-12 · Oceanside Unified
The district's assigned schools for this parcel, from its attendance boundaries and rules. Boundaries change: confirm with the district before you buy.
Comparable Properties
5 comps foundThis Property
$2,688
Comp Average
$2,557

509 Calle Montecito
2bd / 1ba · 806 sqft · Condo
$350K
Est. $2,688/mo

521 Calle Montecito
2bd / 1ba · 806 sqft · Condo
$350K
Est. $2,498/mo
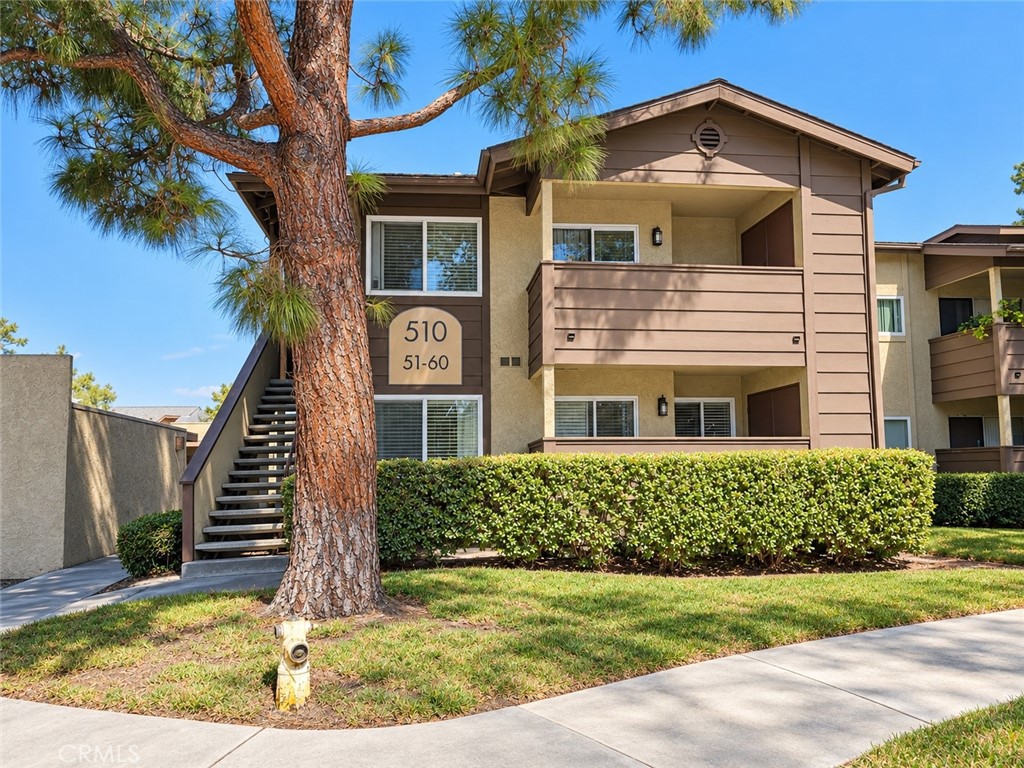
510 Calle Montecito
2bd / 1ba · 806 sqft · Condo
$359K
Est. $2,505/mo

513 Calle Montecito
2bd / 2ba · 856 sqft · Condo
$400K
Est. $2,547/mo

502 Calle Montecito
2bd / 2ba · 856 sqft · Condo
$414K
Est. $2,547/mo
Comps based on same zip code, similar beds (±1), price range (60-150%).
Short-term not available here. Outside Oceanside's Coastal Zone: inland short-term rentals are banned. See the rules
Investment Score
12 leases of 2-bed condos & townhomes within 1 mi · $2,334–$2,652
Blended 50/50 with the zip's market median ($2,900)
Rent − PITIA
Incl. vacancy, PM, maint, capex
What would make this work?
$1,362/mo short at 20% down; 74% down or +$1,769/mo rent closes it.
- Break-even price
- $189,749
- Break-even rent
- $4,457/mo
- Cashflow at 35% down
- −$982/mo
- Down payment to break even
- 74%
- Rate to break even
- Not reachable
48% under asking
$1,769/mo above the estimate
$272,320 cash
Negative even at a 0% loan
Need ≥ 1.25 for DSCR loan
Lower = better for investors
* Modelled at 20% down, 7.36% rate, 30yr · vacancy 8% · PM 10% · capex 5% · maintenance 1%/yr.
Estimates only. Not financial advice. Verify all figures independently with a licensed professional before making any investment decision.
Open Full Calculator