
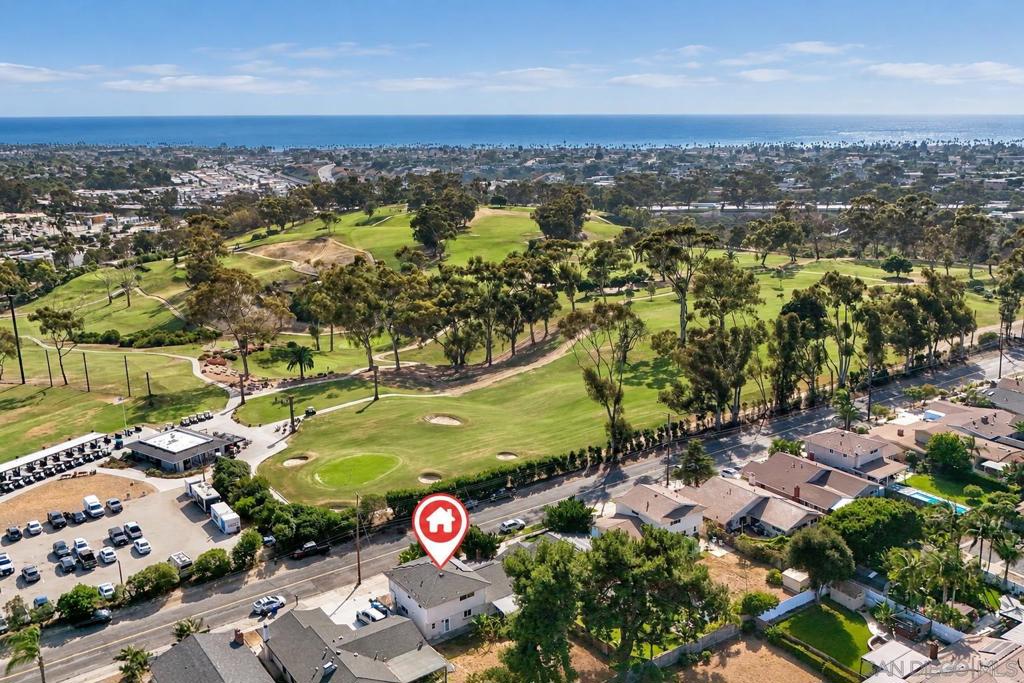
355 Islander St.
Ctop 80%Oceanside, CA 92054
Pass at asking: -$6,222/mo full cashflow at 20% down, 7.49% rate.
Works at $517,295 (61% under asking), or at 88% down.
Rent $5,182/mo from 9 leases of 3-bed houses within 2 mi ($4,759–$6,264).
Beds
3
Baths
2.5
Sqft
2,021
Year Built
1984
Days on Market
0
Property Type
Single Family
HOA/mo
N/A
MLS ID
260026259SD
This property is in Oceanside (92054). View neighborhood stats →
About This Property
Come enjoy this beautifully remodeled Spanish Coastal home for sale! Located in the Sea Mesa neighborhood, approximately 1.5 miles from the Oceanside Pier, this bright and open floor plan features abundant natural light, privacy, and western views. Key Features: * 3 oversized bedrooms and an en-suite spa-like bathroom * Detached, fully built-out office space * Dedicated laundry/mudroom * Upgraded, solar-ready electrical panel * RV parking * Expansive 17,000 sq. ft. lot situated on the ridge of the neighborhood * Beautifully landscaped yard offering ultimate privacy and open western views from the backyard Every inch of this property has been thoughtfully renovated to deliver modern comfort and timeless coastal style. Come enjoy this beautifully remodeled Spanish Coastal home for sale! Located in the Sea Mesa neighborhood, approximately 1.5 miles from the Oceanside Pier, this bright and open floor plan features abundant natural light, privacy, and western views. Key Features: * 3 oversized bedrooms and an en-suite spa-like bathroom * Detached, fully built-out office space * Dedicated laundry/mudroom * Upgraded, solar-ready electrical panel * RV parking * Expansive 17,000 sq. ft. lot situated on the ridge of the neighborhood * Beautifully landscaped yard offering ultimate privacy and open western views from the backyard Every inch of this property has been thoughtfully renovated to deliver modern comfort and timeless coastal style.
Mortgage Calculator
Est. Monthly Payment
$9,109
Location
Loading map...
Comparable Properties
5 comps foundThis Property
$5,182
Comp Average
$5,723
2190 Greenbrier Drive
4bd / 2.5ba · 1,899 sqft · Single Family
$955K
Est. $5,188/mo

2302 Greenbrier Drive
4bd / 2.5ba · 2,191 sqft · Single Family
$1.29M
Est. $6,189/mo

418 Mainsail Road
4bd / 2.5ba · 2,154 sqft · Single Family
$1.37M
Est. $5,185/mo

1815 Bailey Drive
3bd / 2ba · 2,009 sqft · Single Family
$1.75M
Est. $6,318/mo

1315 Crestridge Dr.
4bd / 2ba · 1,900 sqft · Single Family
$1.60M
Est. $5,735/mo
Comps based on same zip code, similar beds (±1), price range (60-150%).
Investment Score
9 leases of 3-bed houses within 2 mi · $4,759–$6,264
Blended 50/50 with the zip's market median ($5,257)
Rent − PITIA
Incl. vacancy, PM, maint, capex
What would make this work?
$6,222/mo short at 20% down; 88% down or +$8,081/mo rent closes it.
- Break-even price
- $517,295
- Break-even rent
- $13,263/mo
- Cashflow at 35% down
- −$4,835/mo
- Down payment to break even
- 88%
- Rate to break even
- Not reachable
61% under asking
$8,081/mo above the estimate
$1,165,120 cash
Negative even at a 0% loan
Need ≥ 1.25 for DSCR loan
Lower = better for investors
* Modelled at 20% down, 7.49% rate, 30yr · vacancy 8% · PM 10% · capex 5% · maintenance 1%/yr.
Estimates only. Not financial advice. Verify all figures independently with a licensed professional before making any investment decision.
Open Full Calculator