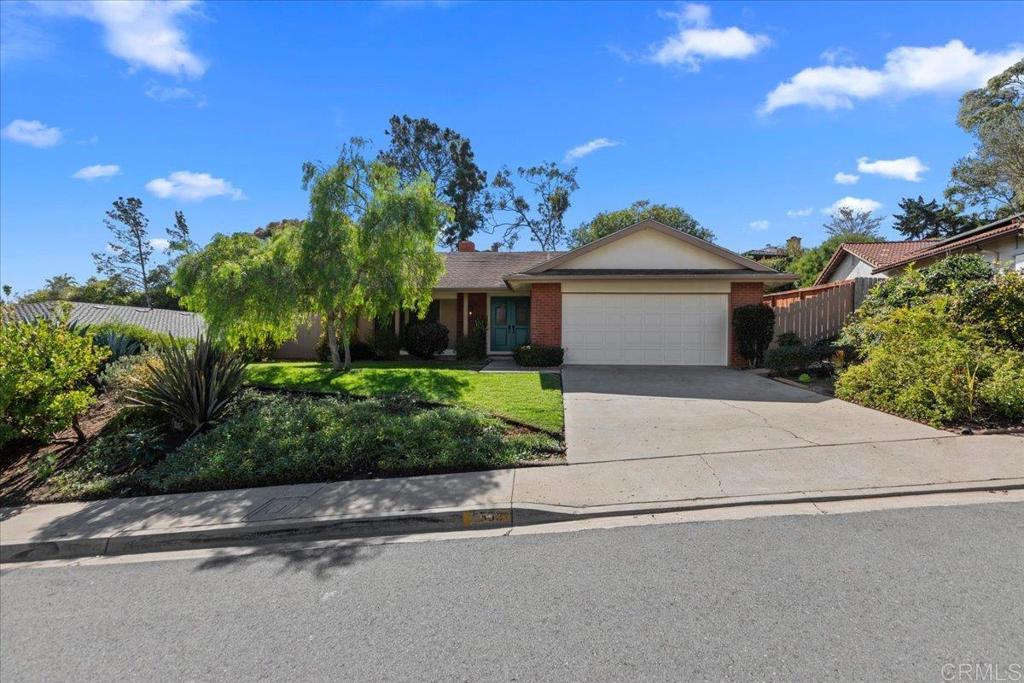
2553 Pinewood
Ctop 80%Del Mar, CA 92014
One license per person in San Diego: whether you can hold it depends on you, not only the home.
9 licensed short-term rentals within ½ mile (2 whole home), from the cities' license and permit lists of Nov 6, 2026.
Pass at asking: -$11,651/mo full cashflow at 20% down, 7.43% rate.
Works at $777,966 (66% under asking), or at 94% down.
Rent $7,760/mo from 10 leases of 3-bed houses within 1 mi ($6,601–$11,493).
Beds
3
Baths
2
Sqft
1,449
Year Built
1970
Days on Market
2
Property Type
Single Family
HOA/mo
N/A
MLS ID
PTP2607941
This property is in Del Mar (92014). View neighborhood stats →
About This Property
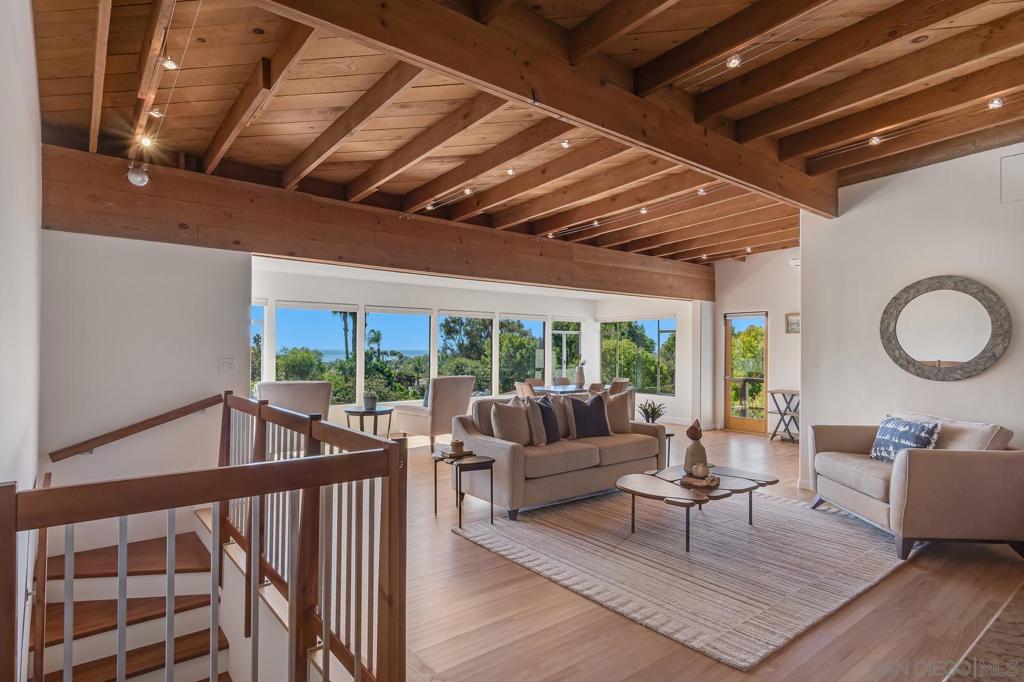
Amazing opportunity to purchase a single level Del Mar Heights home with a chance to put your stamp on it! Come see this 3 bedroom, 2 bath home with nice front and back yard space. Living room has great front windows and classic brick fireplace. Rear Family room opens to covered patio for easy entertaining. Home has new vinyl floors and fresh paint throughout. Easy to move in and update as you go. Get into the neighborhood with the ability to continue upgrading in a neighborhood that will support continued development and remodeling to build equity.
Mortgage Calculator
Est. Monthly Payment
$15,714
Location
Loading map...
Zoned Schools
Elementary
Del Mar Heights Elementary · grades K-6 · Del Mar Union Elementary
Middle
Earl Warren Middle · grades 7-8 · San Dieguito Union High
High
Torrey Pines High · grades 9-12 · San Dieguito Union High
The district's assigned schools for this parcel, from its attendance boundaries and rules. Boundaries change: confirm with the district before you buy.
Comparable Properties
2 comps foundThis Property
$7,760
Comp Average
$7,750
1117 Solana Dr.
4bd / 3ba · 2,171 sqft · Single Family
$2.88M
Est. $9,456/mo

13452 Portofino
3bd / 2ba · 1,527 sqft · Single Family
$2.29M
Est. $6,043/mo
Comps based on same zip code, similar beds (±1), price range (60-150%).
Investment Score
10 leases of 3-bed houses within 1 mi · $6,601–$11,493
Rent − PITIA
Incl. vacancy, PM, maint, capex
What would make this work?
$11,651/mo short at 20% down; 94% down or +$15,131/mo rent closes it.
- Break-even price
- $777,966
- Break-even rent
- $22,891/mo
- Cashflow at 35% down
- −$9,260/mo
- Down payment to break even
- 94%
- Rate to break even
- Not reachable
66% under asking
$15,131/mo above the estimate
$2,157,300 cash
Negative even at a 0% loan
Need ≥ 1.25 for DSCR loan
Lower = better for investors
* Modelled at 20% down, 7.43% rate, 30yr · vacancy 8% · PM 10% · capex 5% · maintenance 1%/yr.
Estimates only. Not financial advice. Verify all figures independently with a licensed professional before making any investment decision.
Open Full Calculator