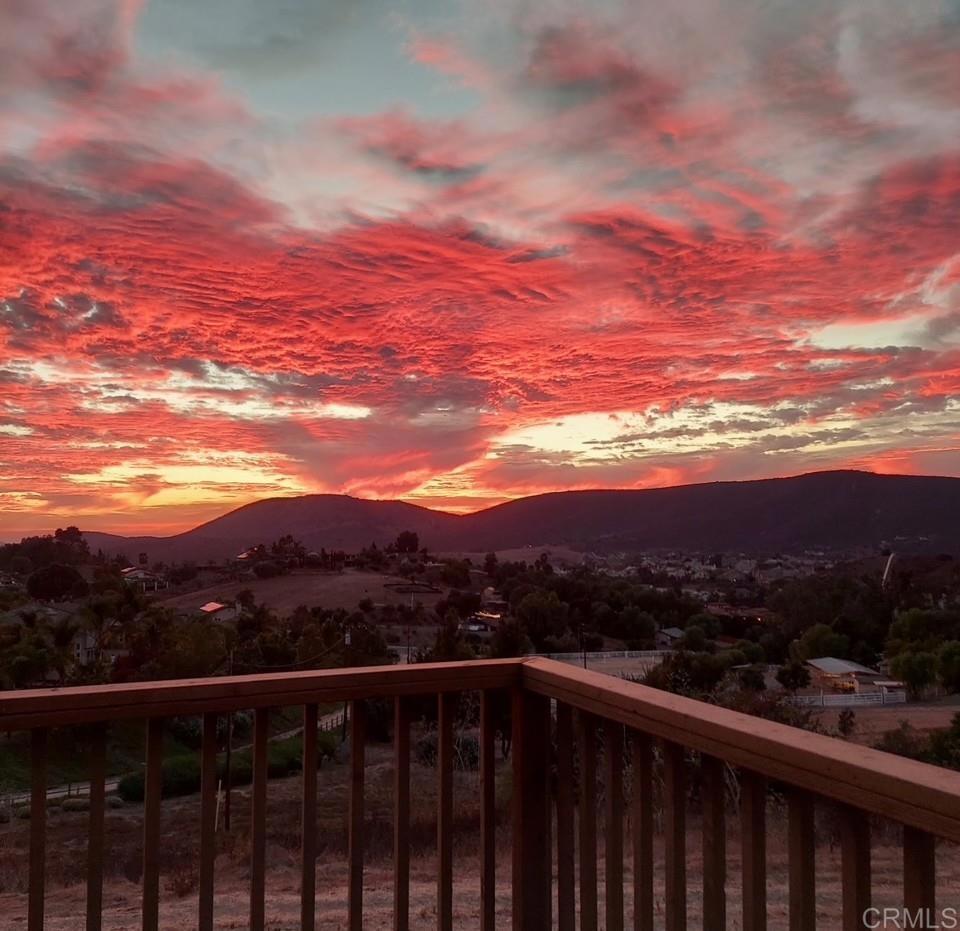
1320 Richland Rd
Dbottom 20%San Marcos, CA 92069Neighborhood: Twin Oaks Valley
Pass at asking: -$23,953/mo full cashflow at 20% down, 7.36% rate.
Works at $364,684 (90% under asking); even all cash loses money at asking.
Rent $3,619/mo from 8 leases of 1–3 bed houses within 2 mi ($3,404–$3,800).
Beds
2
Baths
1
Sqft
1,350
Year Built
1936
Days on Market
139
Property Type
Single Family
HOA/mo
N/A
MLS ID
NDP2606184
This property is in San Marcos (92069). View neighborhood stats →
About This Property
Come see the 20.2 acres of rolling hills and serene setting in prestigious San Marcos Farms! Seller is motivated to work with any interested in purchasing now. Property has a home/structure and some containers on site. Current San Marcos city zone is for one acre lots. Expired map needs updating and resubmittal to proceed. New sewer and wastewater treatment coming to the area. VID 1" water meter and electric meter at site. Value is in the land. San Marcos is known for excellent schools and parks. Named by Fortune Magazine as one of the best cities to raise a family and by another source one of America's Safest cities. Now is the time to invest in a legacy property.
Mortgage Calculator
Est. Monthly Payment
$23,824
Location
Loading map...
Zoned Schools
Elementary
Twin Oaks Elementary · grades K-5 · San Marcos Unified
Middle
Woodland Park Middle · grades 6-8 · San Marcos Unified
High
Mission Hills High · grades 9-12 · San Marcos Unified
The district's assigned schools for this parcel, from its attendance boundaries and rules. Boundaries change: confirm with the district before you buy.
Short-term not available here. San Marcos does not allow short-term rentals in residential zones. See the rules
Investment Score
8 leases of 1–3 bed houses within 2 mi · $3,404–$3,800
Rent − PITIA
Incl. vacancy, PM, maint, capex
What would make this work?
$23,953/mo short at 20% down; +$31,108/mo rent closes it.
- Break-even price
- $364,684
- Break-even rent
- $34,727/mo
- Cashflow at 35% down
- −$20,334/mo
- Down payment to break even
- Not reachable
- Rate to break even
- Not reachable
90% under asking
$31,108/mo above the estimate
Negative even all-cash
Negative even at a 0% loan
Need ≥ 1.25 for DSCR loan
Lower = better for investors
* Modelled at 20% down, 7.36% rate, 30yr · vacancy 8% · PM 10% · capex 5% · maintenance 1%/yr.
Estimates only. Not financial advice. Verify all figures independently with a licensed professional before making any investment decision.
Open Full Calculator