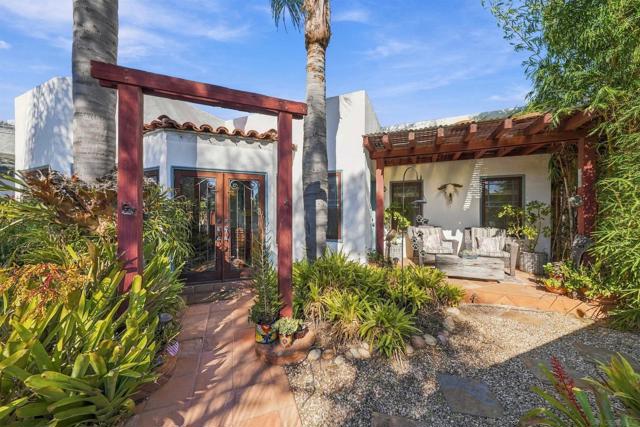
964 Olive Ave.
Dbottom 20%Coronado, CA 92118
Pass at asking: -$16,264/mo full cashflow at 20% down, 7.36% rate.
Works at $620,870 (77% under asking); even all cash loses money at asking.
Rent $6,162/mo from 16 leases of 3-bed houses within 1 mi, same school area ($5,727–$6,728).
Beds
3
Baths
2
Sqft
1,383
Year Built
1930
Days on Market
1
Property Type
Single Family
HOA/mo
N/A
MLS ID
260027058SD
This property is in Coronado (92118). Browse neighborhood analytics →
About This Property
A rare opportunity to own a piece of Coronado history! Situated on a desirable corner lot, this 1930-built property offers 3 bedrooms, 2 bathrooms, and endless potential in one of Coronado's most sought-after locations. Rich in vintage character, the home presents an opportunity for buyers looking to restore, renovate, or reimagine a classic Coronado residence. Whether you're envisioning a thoughtful renovation or exploring the possibilities of the corner parcel, this property offers a unique opportunity to create something special in an exceptional coastal community. Bring your vision and imagination!
Mortgage Calculator
Est. Monthly Payment
$18,718
Location
Loading map...
Zoned Schools
Middle
Coronado Middle · grades 6-8 · Coronado Unified
High
Coronado High · grades 9-12 · Coronado Unified
The district's assigned schools for this parcel, from its attendance boundaries and rules. Boundaries change: confirm with the district before you buy.
Comparable Properties
5 comps foundThis Property
$6,162
Comp Average
$6,171

1414 4th St
3bd / 2ba · 1,608 sqft · Single Family
$2.10M
Est. $6,181/mo

836 C Ave.
3bd / 2.5ba · 1,521 sqft · Single Family
$2.30M
Est. $6,659/mo

332 Glorietta Pl
2bd / 2ba · 1,088 sqft · Single Family
$2.00M
Est. $5,281/mo

911 9th St
3bd / 2.5ba · 1,461 sqft · Single Family
$3.00M
Est. $6,333/mo

810 2nd Street
3bd / 3ba · 1,492 sqft · Single Family
$2.50M
Est. $6,400/mo
Comps based on same zip code, similar beds (±1), price range (60-150%).
Short-term not available here. Coronado bans stays of 25 days or less in residential zones. See the rules
Investment Score
16 leases of 3-bed houses within 1 mi, same school area · $5,727–$6,728
Rent − PITIA
Incl. vacancy, PM, maint, capex
What would make this work?
$16,264/mo short at 20% down; +$21,122/mo rent closes it.
- Break-even price
- $620,870
- Break-even rent
- $27,284/mo
- Cashflow at 35% down
- −$13,420/mo
- Down payment to break even
- Not reachable
- Rate to break even
- Not reachable
77% under asking
$21,122/mo above the estimate
Negative even all-cash
Negative even at a 0% loan
Need ≥ 1.25 for DSCR loan
Lower = better for investors
* Modelled at 20% down, 7.36% rate, 30yr · vacancy 8% · PM 10% · capex 5% · maintenance 1%/yr.
Estimates only. Not financial advice. Verify all figures independently with a licensed professional before making any investment decision.
Open Full Calculator