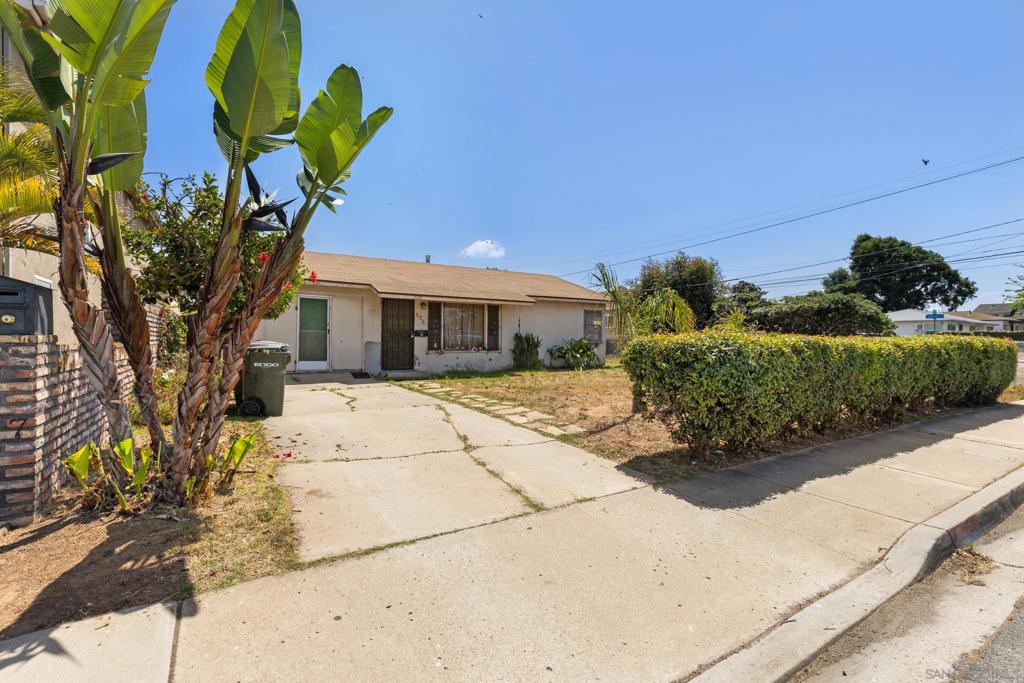
535 12th St
Ctop 80%Imperial Beach, CA 91932
Pass at asking: -$4,176/mo full cashflow at 20% down, 7.36% rate.
Works at $278,625 (66% under asking), or at 94% down.
Rent $2,765/mo from 8 leases of 2-bed houses within 1 mi ($2,628–$2,930).
Beds
2
Baths
1
Sqft
780
Year Built
1956
Days on Market
46
Property Type
Single Family
HOA/mo
N/A
MLS ID
260023859SD
This property is in Imperial Beach (91932). Browse neighborhood analytics →
About This Property
Located in the Highly Desirable Neighborhood of Dolphin Bay, Imperial Beach, sits a Unique Opportunity to Owner Occupy while Building your Investment Portfolio. Great Development Opportunity. Zoned R-3000, on a 6,924 sq ft lot, with a variety of potential uses. Previously operated as a rental SFR, this entry level investment is ideal for an Owner Occupant or a creative investor building equity. Remodel and live/rent in front house with the opportunity to build additional units or ADUs. Come Build Your Dream Home Here in Imperial Beach
Mortgage Calculator
Est. Monthly Payment
$5,617
Location
Loading map...
Zoned Schools
Elementary
Bayside STEAM Academy · grades K-6 · South Bay Union
Middle
Mar Vista Academy · grades 7-8 · Sweetwater Union High
High
Mar Vista Senior High · grades 9-12 · Sweetwater Union High
The district's assigned schools for this parcel, from its attendance boundaries and rules. Boundaries change: confirm with the district before you buy.
Comparable Properties
5 comps foundThis Property
$2,765
Comp Average
$2,993

980 Georgia Street
2bd / 1ba · 775 sqft · Single Family
$599K
Est. $2,922/mo

1139 Oneonta Ave
3bd / 2ba · 1,008 sqft · Single Family
$779K
Est. $3,196/mo

577 Florence St
2bd / 2ba · 768 sqft · Single Family
$700K
Est. $2,649/mo

1119 Oneonta Ave
3bd / 2ba · 1,008 sqft · Single Family
$800K
Est. $3,205/mo

523 8th St.
2bd / 1ba · 895 sqft · Single Family
$849K
Est. $2,992/mo
Comps based on same zip code, similar beds (±1), price range (60-150%).
Investment Score
8 leases of 2-bed houses within 1 mi · $2,628–$2,930
Blended 50/50 with a property-level estimate
Rent − PITIA
Incl. vacancy, PM, maint, capex
What would make this work?
$4,176/mo short at 20% down; 94% down or +$5,424/mo rent closes it.
- Break-even price
- $278,625
- Break-even rent
- $8,189/mo
- Cashflow at 35% down
- −$3,323/mo
- Down payment to break even
- 94%
- Rate to break even
- Not reachable
66% under asking
$5,424/mo above the estimate
$775,500 cash
Negative even at a 0% loan
Need ≥ 1.25 for DSCR loan
Lower = better for investors
* Modelled at 20% down, 7.36% rate, 30yr · vacancy 8% · PM 10% · capex 5% · maintenance 1%/yr.
Estimates only. Not financial advice. Verify all figures independently with a licensed professional before making any investment decision.
Open Full Calculator