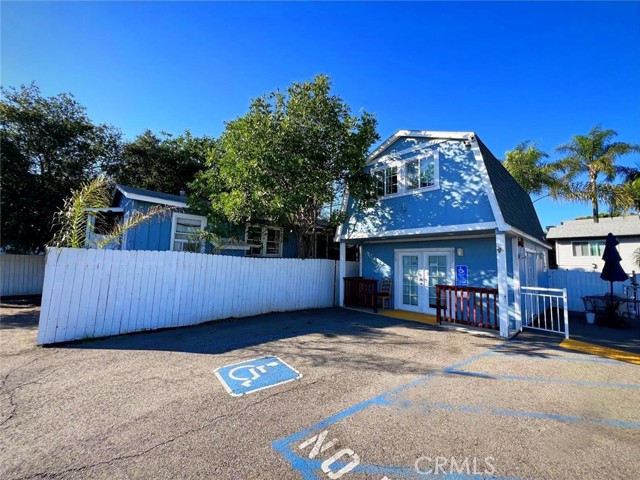
408 N Pico ave
Ctop 80%Fallbrook, CA 92028
Pass at asking: -$5,299/mo full cashflow at 20% down, 7.36% rate.
Works at $306,554 (69% under asking), or at 97% down.
Rent $3,042/mo: zip market median for this bed count.
Beds
2
Baths
2
Sqft
1,440
Year Built
1953
Days on Market
138
Property Type
Commercial/Residential
HOA/mo
N/A
MLS ID
OC26105529
This property is in Fallbrook (92028). Browse neighborhood analytics →
About This Property
REDUCED! HIGH-VISIBILITY CORNER!!! RESIDENTIAL DUPLEX + COMMERICIAL OFFICE with MAJOR RE-DEVELOPMENT POTENTIAL. Own the entire corner. This property offers a rare chance for an owner-occupant seeking an income-producing property or an investor ready to capitalize on the site's serious redevelopment upside. This package includes three contiguous lots, totaling 10,653 sq ft and zoned FB-V2--a mixed-use designation allowing both commercial and residential development. The property sits at a signalized hard corner, commanding maximum visibility and frontage. Currently, the property consists of a residential duplex and a commercial office building, all with clean interiors & dependable tenants offering great stability. The major upside is in the right development strategy. This already income-producing property then becomes an income-producing POWERHOUSE. The caliber of exposure, zoning versatility, and proven income stream is nearly impossible to replicate at this price point.
Mortgage Calculator
Est. Monthly Payment
$6,808
Location
Loading map...
Zoned Schools
Elementary
William H. Frazier Elementary · grades K-6 · Fallbrook Union Elementary
Middle
James E. Potter Intermediate · grades 7-8 · Fallbrook Union Elementary
High
Fallbrook High · grades 9-12 · Fallbrook Union High
The district's assigned schools for this parcel, from its attendance boundaries and rules. Boundaries change: confirm with the district before you buy.
Investment Score
Zip market median for this bed count
Thin data: no closed leases like this one nearby.
Rent − PITIA
Incl. vacancy, PM, maint, capex
What would make this work?
$5,299/mo short at 20% down; 97% down or +$6,882/mo rent closes it.
- Break-even price
- $306,554
- Break-even rent
- $9,924/mo
- Cashflow at 35% down
- −$4,265/mo
- Down payment to break even
- 97%
- Rate to break even
- Not reachable
69% under asking
$6,882/mo above the estimate
$969,903 cash
Negative even at a 0% loan
Need ≥ 1.25 for DSCR loan
Lower = better for investors
* Modelled at 20% down, 7.36% rate, 30yr · vacancy 8% · PM 10% · capex 5% · maintenance 1%/yr.
Estimates only. Not financial advice. Verify all figures independently with a licensed professional before making any investment decision.
Open Full Calculator