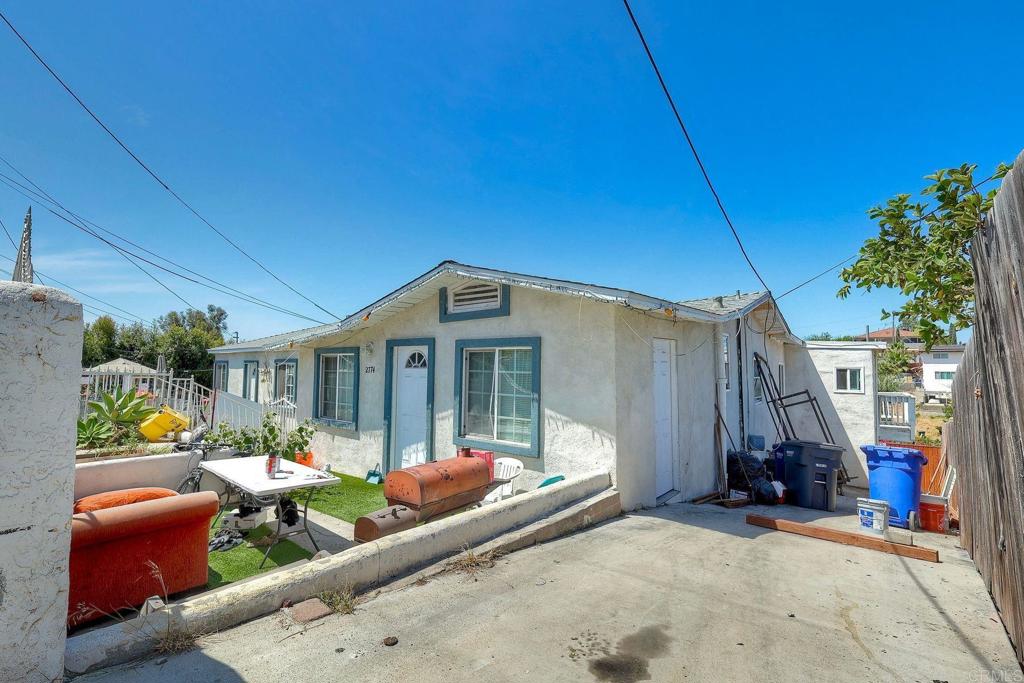
2774 Vista Way
Btop 30% of multifamilyNational City, CA 91950
Pass at asking: -$3,481/mo full cashflow at 20% down, 7.43% rate.
Works at $796,881 (36% under asking), or at 61% down.
Rent $7,948/mo: 4 units of about 525 sqft, each priced from up to 57 closed leases within 2 mi ($7,372–$8,512).
Beds
—
Baths
—
Sqft
2,098
Year Built
1925
Days on Market
109
Property Type
Multi-Family
HOA/mo
N/A
MLS ID
PTP2605619
This property is in National City (91950). Browse neighborhood analytics →
About This Property
Excellent four-unit investment opportunity in National City. Great opportunity for investors or owner-occupants. Conveniently located near shopping, schools, public transportation, and freeway access. Property is being sold as a legal four-unit property. An additional nonconforming space currently generates rental income but is not included in the legal unit count. Buyer and Buyer's Agent to independently verify all information, including but not limited to rents, income, expenses, operating history, cap rate, square footage, permits, zoning, legal use, and all other property details prior to the close of escrow. Information is deemed reliable but not guaranteed.
Small multifamily · 4 units
Valued on income: each unit priced from closed leases nearby, then added up. County records: 4 units.
| Unit | Units | Rent each | Subtotal |
|---|---|---|---|
| Average unit~525 sqft · 57 leases within 2 mi | 4 | $1,987 | $7,948 |
| Gross rent, all units | $7,948/mo | ||
- Gross rent multiplier
- 13.1
- Price per unit
- $312,500
- NOI (a year)
- $46,328
- Cap rate
- 3.71%
Price ÷ a year's gross rent
Median $525,000 across 96 listed 2–4 unit buildings in San Diego County
Default vacancy, management, upkeep, tax, insurance
Its grade compares it with other multifamily listings only: a building valued on income isn't ranked against houses and condos.
House hack with FHA
Live in the one unit, rent the other 3.
FHA likely won't lend on this one at this price. For 3 and 4 units it counts 75% of all the units' rent ($5,961/mo), and that has to cover the full payment ($10,683/mo). The numbers below are for reference.
- Down payment
- $43,750
- Your cost to live there
- $7,135/mo
- More than renting it
- $5,148/mo
3.5% · plus closing costs
After $5,961/mo from the other units
vs $1,987/mo to rent the same unit
How this is figured
- Loan $1,227,359 ($1,206,250 + 1.75% upfront mortgage insurance) at 7.18% (Freddie Mac 30-year average, week of Nov 5, 2026), 30 years: $8,315/mo
- FHA mortgage insurance $754/mo · property tax $1,250/mo · insurance $365/mo
- Vacancy, management and capex on the rented units, upkeep on the building: $2,413/mo
- FHA allows 3.5% down on 2–4 units when you live in one, up to HUD's 2026 San Diego County limit for 4 units ($2,123,100). Lenders count only part of the other units' rent toward qualifying.
Compare other buildings on the small multifamily page.
Mortgage Calculator
Est. Monthly Payment
$8,559
Location
Loading map...
Zoned Schools
Elementary
Lincoln Acres · grades PK-6 · National Elementary
Middle
Granger Junior High · grades 7-9 · Sweetwater Union High
High
Sweetwater High · grades 9-12 · Sweetwater Union High
The district's assigned schools for this parcel, from its attendance boundaries and rules. Boundaries change: confirm with the district before you buy.
Comparable Properties
3 comps foundThis Property
$7,948
Comp Average
$9,419

1704 B Avenue
2,272 sqft · Multi-Family
$1.20M
Est. $9,475/mo

1313 9th Street
1,600 sqft · Multi-Family
$1.05M
Est. $6,828/mo

1101 9th
3,710 sqft · Multi-Family
$1.65M
Est. $11,955/mo
Comps based on same zip code, similar beds (±1), price range (60-150%).
This is a 4-unit building: on the mid-term and short-term tabs, enter the rent, nightly rate and occupancy for all units combined.
Investment Score
4 units of about 525 sqft, each priced from up to 57 closed leases within 2 mi · $7,372–$8,512
Rent − PITIA
Incl. vacancy, PM, maint, capex
What would make this work?
$3,481/mo short at 20% down; 61% down or +$4,521/mo rent closes it.
- Break-even price
- $796,881
- Break-even rent
- $12,469/mo
- Cashflow at 35% down
- −$2,179/mo
- Down payment to break even
- 61%
- Rate to break even
- 1.53%
36% under asking
$4,521/mo above the estimate
$762,500 cash
at 20% down
Need ≥ 1.25 for DSCR loan
Lower = better for investors
* Modelled at 20% down, 7.43% rate, 30yr · vacancy 8% · PM 10% · capex 5% · maintenance 1%/yr.
Estimates only. Not financial advice. Verify all figures independently with a licensed professional before making any investment decision.
Open Full Calculator