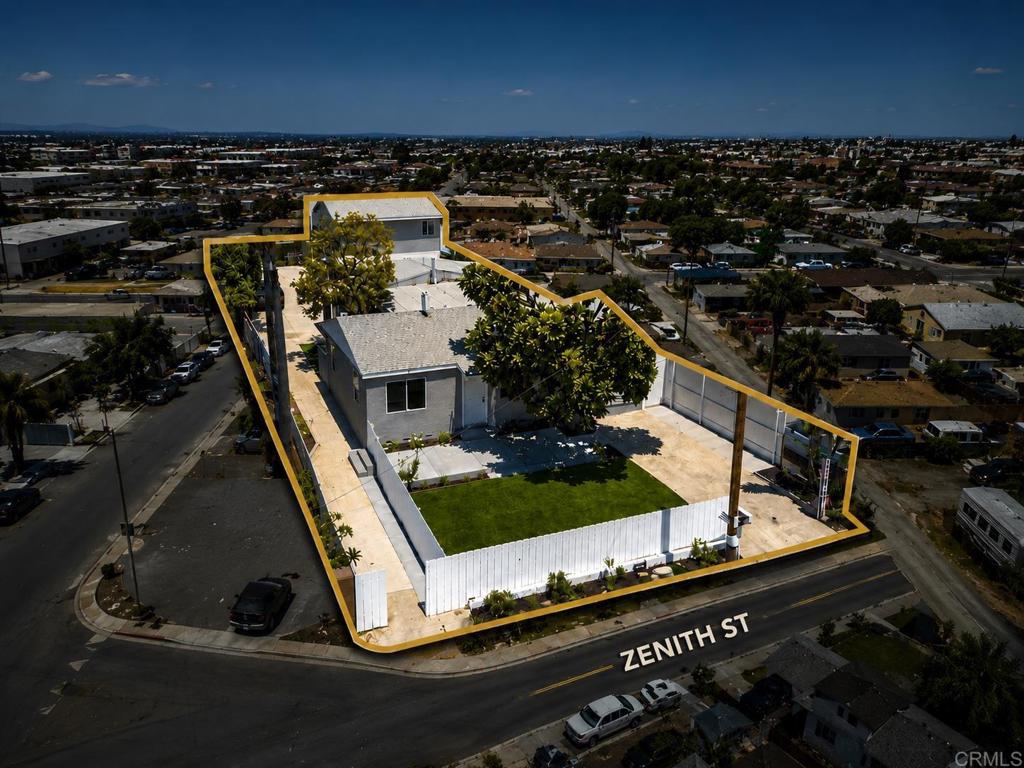
230 Zenith Street
Ctop 80% of multifamilyChula Vista, CA 91911
Pass at asking: -$4,897/mo full cashflow at 20% down, 7.43% rate.
Works at $727,265 (47% under asking), or at 72% down.
Rent $7,254/mo: 3 units of about 747 sqft, each priced from up to 45 closed leases within 2 mi ($6,870–$7,788).
Beds
—
Baths
—
Sqft
2,240
Year Built
1957
Days on Market
105
Property Type
Multi-Family
HOA/mo
N/A
MLS ID
PTP2605686
This property is in Chula Vista (91911). Browse neighborhood analytics →
About This Property
Skip the renovation. Skip the lease-up. Step into a fully performing investment. With tenants already in place, this updated triplex offers the kind of investment opportunity that's becoming increasingly difficult to find. Set on a 7,000+ sq. ft. lot, each residence enjoys its own private yard, completelyseperate and a layout that lives independently from the others, creating lasting tenant appeal and strong rental stability. The unit mix includes a 3-bedroom, 2-bath front home, a 2-bedroom, 2-bath middle unit, and a recently updated 2+-bedroom, 2-bath rear townhome. Major capital improvements have already been completed, including newer roofs on all three buildings, an updated HVAC system and ducting in the front home, remodeled kitchens and bathrooms, updated flooring, windows, cabinetry, plumbing, electrical, and fresh interior finishes throughout. Strengthen your portfolio with a performing asset, execute a long-term hold strategy, or capitalize on future rental growth with long-term upside.
Small multifamily · 3 units
Valued on income: each unit priced from closed leases nearby, then added up. County records: 3 units.
| Unit | Units | Rent each | Subtotal |
|---|---|---|---|
| Average unit~747 sqft · 45 leases within 2 mi | 3 | $2,418 | $7,254 |
| Gross rent, all units | $7,254/mo | ||
- Gross rent multiplier
- 15.7
- Price per unit
- $454,967
- NOI (a year)
- $36,576
- Cap rate
- 2.68%
Price ÷ a year's gross rent
Median $512,250 across 4 listed 2–4 unit buildings in 91911
Default vacancy, management, upkeep, tax, insurance
Its grade compares it with other multifamily listings only: a building valued on income isn't ranked against houses and condos.
House hack with FHA
Live in the one unit, rent the other 2.
FHA likely won't lend on this one at this price. For 3 and 4 units it counts 75% of all the units' rent ($5,441/mo), and that has to cover the full payment ($11,665/mo). The numbers below are for reference.
- Down payment
- $47,772
- Your cost to live there
- $9,079/mo
- More than renting it
- $6,661/mo
3.5% · plus closing costs
After $4,836/mo from the other units
vs $2,418/mo to rent the same unit
How this is figured
- Loan $1,340,178 ($1,317,129 + 1.75% upfront mortgage insurance) at 7.18% (Freddie Mac 30-year average, week of Nov 5, 2026), 30 years: $9,079/mo
- FHA mortgage insurance $823/mo · property tax $1,365/mo · insurance $398/mo
- Vacancy, management and capex on the rented units, upkeep on the building: $2,250/mo
- FHA allows 3.5% down on 2–4 units when you live in one, up to HUD's 2026 San Diego County limit for 3 units ($1,708,400). Lenders count only part of the other units' rent toward qualifying.
Compare other buildings on the small multifamily page.
Mortgage Calculator
Est. Monthly Payment
$9,346
Location
Loading map...
Zoned Schools
Elementary
Otay Elementary · grades PK-6 · Chula Vista Elementary
Middle
Castle Park Middle · grades 7-8 · Sweetwater Union High
High
Castle Park Senior High · grades 9-12 · Sweetwater Union High
The district's assigned schools for this parcel, from its attendance boundaries and rules. Boundaries change: confirm with the district before you buy.
Comparable Properties
3 comps foundThis Property
$7,254
Comp Average
$6,150

1835 Rios Avenue
2,557 sqft · Multi-Family
$1.30M
Est. $8,112/mo

458 L Street
4bd / 2ba · 1,800 sqft · Duplex
$1.05M
Est. $5,408/mo

1839 Rios Avenue
1,415 sqft · Multi-Family
$1000K
Est. $4,930/mo
Comps based on same zip code, similar beds (±1), price range (60-150%).
This is a 3-unit building: on the mid-term and short-term tabs, enter the rent, nightly rate and occupancy for all units combined.
Investment Score
3 units of about 747 sqft, each priced from up to 45 closed leases within 2 mi · $6,870–$7,788
Rent − PITIA
Incl. vacancy, PM, maint, capex
What would make this work?
$4,897/mo short at 20% down; 72% down or +$6,360/mo rent closes it.
- Break-even price
- $727,265
- Break-even rent
- $13,614/mo
- Cashflow at 35% down
- −$3,476/mo
- Down payment to break even
- 72%
- Rate to break even
- Not reachable
47% under asking
$6,360/mo above the estimate
$982,728 cash
Negative even at a 0% loan
Need ≥ 1.25 for DSCR loan
Lower = better for investors
* Modelled at 20% down, 7.43% rate, 30yr · vacancy 8% · PM 10% · capex 5% · maintenance 1%/yr.
Estimates only. Not financial advice. Verify all figures independently with a licensed professional before making any investment decision.
Open Full Calculator