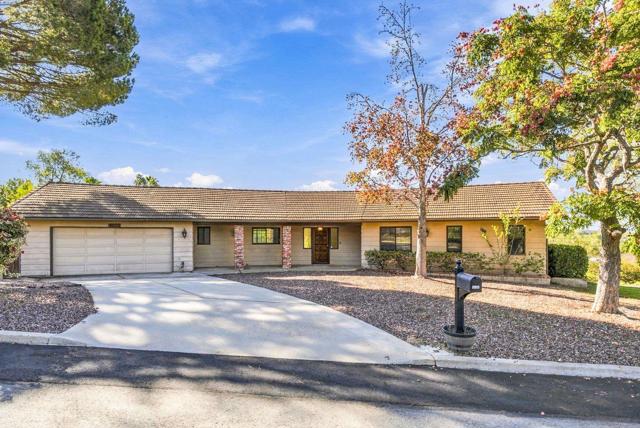
1256 Olive
Ctop 80%Fallbrook, CA 92028
Pass at asking: -$3,761/mo full cashflow at 20% down, 7.43% rate.
Works at $359,391 (58% under asking), or at 84% down.
Rent $3,585/mo from 9 leases of 1–3 bed houses within 2 mi ($3,738–$4,128).
Beds
2
Baths
3
Sqft
1,824
Year Built
1985
Days on Market
—
Property Type
Single Family
HOA/mo
N/A
MLS ID
260026740SD
This property is in Fallbrook (92028). Browse neighborhood analytics →
About This Property
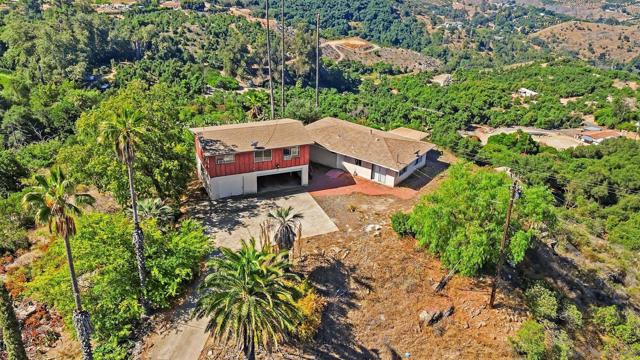
Tucked away on a quiet cul-de-sac in the charming community of Fallbrook, 1256 Olive Avenue offers a unique combination of privacy, versatility, and opportunity. This custom single-story home is designed for comfortable living, featuring an inviting layout, updated luxury laminate flooring, fresh interior paint, and central air conditioning. A spacious wraparound deck extends the living experience outdoors, creating the perfect setting to relax, entertain, and take in beautiful sunset views. Adding to the property's versatility is a separate studio living space located below the main level, complete with a full bathroom, offering an ideal setup for extended family, guests, multigenerational living, or a private retreat. The generous lot presents exciting potential to further enhance the outdoor space, create your own private oasis, or explore additional improvements to maximize the property's possibilities. Covered RV parking adds convenience for those with recreational vehicles or additional storage needs, while the refreshed front yard rockscape provides attractive, low-maintenance curb appeal. Located in an established neighborhood with longtime residents, this peaceful setting offers a sense of community while remaining conveniently close to Fallbrook's local shops, restaurants, schools, parks, and everyday amenities. Enjoy the charm of Fallbrook living with the space, flexibility, and potential to truly make this property your own.
Mortgage Calculator
Est. Monthly Payment
$5,813
Location
Loading map...
Comparable Properties
5 comps foundThis Property
$3,585
Comp Average
$3,603
6133 Rainbow Heights Rd
2bd / 1ba · 1,826 sqft · Single Family
$699K
Est. $3,501/mo

1066 Ridge Heights Drive
2bd / 2ba · 1,839 sqft · Single Family
$725K
Est. $3,414/mo

3101 Cherrypoint Court
3bd / 2.5ba · 1,784 sqft · Single Family
$920K
Est. $3,762/mo

335 Morro Hills Road
2bd / 2ba · 1,792 sqft · Single Family
$899K
Est. $3,547/mo

1221 Palomares Ct.
3bd / 2ba · 1,863 sqft · Single Family
$1.00M
Est. $3,791/mo
Comps based on same zip code, similar beds (±1), price range (60-150%).
Investment Score
9 leases of 1–3 bed houses within 2 mi · $3,738–$4,128
Blended 50/50 with the zip's market median ($3,200)
Rent − PITIA
Incl. vacancy, PM, maint, capex
What would make this work?
$3,761/mo short at 20% down; 84% down or +$4,884/mo rent closes it.
- Break-even price
- $359,391
- Break-even rent
- $8,469/mo
- Cashflow at 35% down
- −$2,876/mo
- Down payment to break even
- 84%
- Rate to break even
- Not reachable
58% under asking
$4,884/mo above the estimate
$713,160 cash
Negative even at a 0% loan
Need ≥ 1.25 for DSCR loan
Lower = better for investors
* Modelled at 20% down, 7.43% rate, 30yr · vacancy 8% · PM 10% · capex 5% · maintenance 1%/yr.
Estimates only. Not financial advice. Verify all figures independently with a licensed professional before making any investment decision.
Open Full Calculator