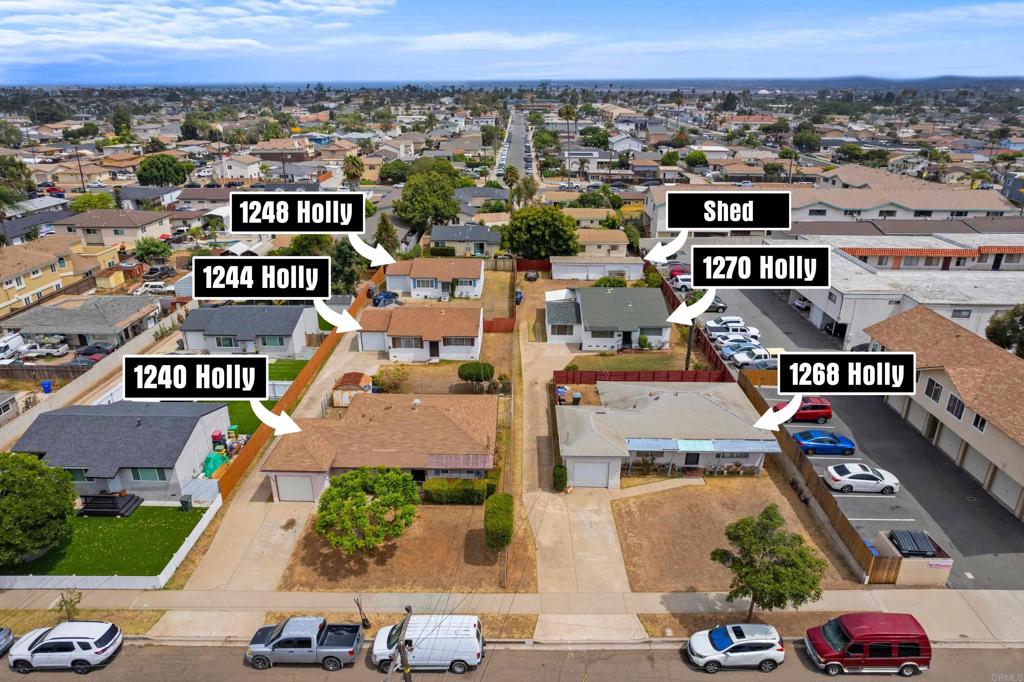
1240 Holly Avenue
Ctop 80% of multifamilyImperial Beach, CA 91932
Pass at asking: -$9,231/mo full cashflow at 20% down, 7.43% rate.
Works at $1,398,023 (46% under asking), or at 72% down.
Rent $13,945/mo: 5 units of about 1,052 sqft, each priced from up to 13 closed leases within 0.5 mi ($12,280–$16,030).
Beds
—
Baths
—
Sqft
5,260
Year Built
1960
Days on Market
74
Property Type
Multi-Family
HOA/mo
N/A
MLS ID
NDP2608136
This property is in Imperial Beach (91932). Browse neighborhood analytics →
About This Property
1240–1270 Holly Avenue represents a rare opportunity to acquire a well maintained, five unit multifamily asset with meaningful value add and redevelopment potential in Imperial Beach, San Diego’s southernmost coastal community. The property is situated west of Interstate 5 and approximately two miles from the Pacific Ocean, placing it within a rapidly evolving coastal submarket characterized by sustained renter demand, ongoing revitalization, and increasing investor interest. Long term family ownership and consistent upkeep underscore the stability and pride of ownership inherent in this offering. The asset comprises approximately 5,260 rentable square feet across five detached single family style residences, supplemented by a large rear storage structure. The unit mix includes two 2 bedroom/1 bath units of roughly 860 square feet each, two 3 bedroom/1 bath units of approximately 1,008 square feet each, and one 2 bedroom/2 bath unit of approximately 1,524 square feet. All homes are believed to have been constructed circa 1960 and feature both front and rear yards. Four units are equipped with single car garages, while one unit offers a covered carport, providing ample on site parking and enhancing tenant convenience. The generous outdoor areas present opportunities for future enhancements that may support increased rental value. The property has been selectively upgraded over time, including interior and exterior painting, new flooring, entry improvements, plumbing and drain line upgrades, replacement of water valves and fixtures, electrical fixture updates with GFCI outlet enhancements, one roof replacement with tune ups on remaining roofs, refinished kitchen and bath surfaces, newer wall heaters, and updated fencing. Despite these improvements, current rents remain below market, and ownership estimates an approximate 15 percent total income upside achievable through unit turnover and additional interior modernization. INVESTMENT PROFILE: The five-unit property is currently positioned to generate approximately $13,450 per month, or $161,400 annually, based on projected rents of five single detached residential units at approximately $3,300, $2,950, $2,750, $2,300 and $2,150/month. At the $2,600,000 asking price: Gross Annual Income: $161,400. Gross Cap Rate: approximately 6.20% Estimated Net Cap Rate: approximately 4.5%, depending on actual operating expenses and insurance. The property is zoned R 3000, permitting detached and attached dwelling units at a maximum density of 14 units per acre. Based on the site’s approximate 0.67 acre footprint, the maximum permitted density is nine dwelling units, with the potential for additional units through the State Density Bonus Law or Accessory Dwelling Units (ADUs), subject to municipal review. Developers may also consider full redevelopment; new primary dwelling units would require discretionary approval, and detailed proposals may be submitted to the City of Imperial Beach Planning Department once project parameters are defined. Numerous recently completed projects in the immediate vicinity provide strong proof of concept for redevelopment in this corridor. With Imperial Beach experiencing ongoing revitalization, improved infrastructure, and sustained private investment, the property offers both current cash flow and long term appreciation potential. Its proximity to beaches, dining, retail, and major transportation routes further enhances its desirability. This offering is well suited for investors seeking to expand cash flow, build equity, and capitalize on one of coastal San Diego’s most active and evolving multifamily submarkets.
Multifamily · 5 units
Valued on income: each unit priced from closed leases nearby, then added up. County records: 5 units.
| Unit | Units | Rent each | Subtotal |
|---|---|---|---|
| Average unit~1,052 sqft · 13 leases within 0.5 mi | 5 | $2,789 | $13,945 |
| Gross rent, all units | $13,945/mo | ||
The listing describes 2 × 2-bed, 2 × 3-bed, 1 × 2-bed. Units of different sizes are priced as the average unit: by bed count alone, unit rents ran 17% off in our backtest.
- Gross rent multiplier
- 15.5
- Price per unit
- $520,000
- NOI (a year)
- $70,923
- Cap rate
- 2.73%
Price ÷ a year's gross rent
Median $320,682 across 32 listed 5+ unit buildings in San Diego County
Default vacancy, management, upkeep, tax, insurance
Its grade compares it with other multifamily listings only: a building valued on income isn't ranked against houses and condos.
Five or more units take a commercial loan, whose terms differ from a home loan's; the cashflow below uses the site's default 20% down, 30-year terms. FHA's owner-occupied 3.5% down covers 2–4 units only.
Compare other buildings on the small multifamily page.
Mortgage Calculator
Est. Monthly Payment
$17,802
Location
Loading map...
Zoned Schools
Elementary
Oneonta Elementary · grades K-6 · South Bay Union
Middle
Mar Vista Academy · grades 7-8 · Sweetwater Union High
High
Mar Vista Senior High · grades 9-12 · Sweetwater Union High
The district's assigned schools for this parcel, from its attendance boundaries and rules. Boundaries change: confirm with the district before you buy.
This is a 5-unit building: on the mid-term and short-term tabs, enter the rent, nightly rate and occupancy for all units combined.
Investment Score
5 units of about 1,052 sqft, each priced from up to 13 closed leases within 0.5 mi · $12,280–$16,030
Rent − PITIA
Incl. vacancy, PM, maint, capex
What would make this work?
$9,231/mo short at 20% down; 72% down or +$11,988/mo rent closes it.
- Break-even price
- $1,398,023
- Break-even rent
- $25,933/mo
- Cashflow at 35% down
- −$6,523/mo
- Down payment to break even
- 72%
- Rate to break even
- Not reachable
46% under asking
$11,988/mo above the estimate
$1,872,000 cash
Negative even at a 0% loan
Need ≥ 1.25 for DSCR loan
Lower = better for investors
* Modelled at 20% down, 7.43% rate, 30yr · vacancy 8% · PM 10% · capex 5% · maintenance 1%/yr.
Estimates only. Not financial advice. Verify all figures independently with a licensed professional before making any investment decision.
Open Full Calculator